Divergence in Trading: What It Is, Types, and Automatic Online Screener
Divergence is one of the most reliable and powerful signals in technical analysis. It warns of the weakness of the current trend even before the price starts to reverse. In this article, we will examine the mathematical essence of divergences, signal types, and show you how to use our automatic online screener for instant entry points in Forex and Cryptocurrencies.
1. What is Divergence and Its Market Significance
Divergence (from the Latin divergere — to move apart) is a disagreement between the price movement on a chart and the readings of a technical indicator (usually an oscillator measuring trend strength). This pattern is a crucial part of algorithmic and manual technical analysis.
Normally, the price and the oscillator move in sync: if the price hits a new high, the indicator should also show a new peak. However, when the momentum fades and a major player starts taking profits, a desynchronization occurs: the price creates a new extreme by inertia, while the indicator already shows a drop in momentum strength.
"Divergence is an X-ray of the market. It shows that inside a visually strong trend, the momentum is already dead, and a reversal is only a matter of time."
Understanding the mechanics of divergence allows traders to avoid entering the market at the very end of a trend and instead open trades in the direction of the upcoming reversal with minimal risk and a high Risk/Reward ratio.
2. Classic Types of Divergences
In a trading strategy, depending on exactly where the divergence occurred and the direction of the potential reversal, two basic types of divergences are distinguished:
Bullish Divergence
BUY Signal (LONG). Forms at the bottom of a downtrend (bearish trend).
The price forms a Lower Low, but the oscillator shows a Higher Low. This indicates that sellers are losing pressure, and the initiative is passing to buyers.
Bearish Divergence
SELL Signal (SHORT). Forms at the top of an uptrend (bullish trend).
The price reaches a new peak making a Higher High, but the oscillator prints a Lower High. Buyers are exhausted, and the market is ready for a correction or a complete trend change.
3. Best Indicators to Find Divergences
Not all tools are suitable for finding divergences. Classic oscillators that measure the rate of price change over a given period handle this task best. On the AEMMtrader platform, the algorithm checks signals across the following indicators:
- RSI (Relative Strength Index): One of the most accurate oscillators. RSI divergences are most effective when peaks are in overbought (>70) or oversold (<30) zones.
- MACD (Moving Average Convergence Divergence): Excellent at showing divergence on both the histogram and signal lines. Ideal for medium-term timeframes.
- CCI (Commodity Channel Index): A highly sensitive indicator that instantly reacts to volatility changes in commodity markets (Gold, Oil, Gas) and Forex.
- Stochastic Oscillator: A fast oscillator well-proven for finding local intraday reversals.
- Ultimate Oscillator (UO): An advanced indicator combining calculations from three different time cycles (e.g., 7, 14, 28), minimizing false signals.
4. AEMMtrader Automatic Online Divergence Screener
Manually searching for patterns is hard and routine work. A trader constantly has to switch between dozens of charts and timeframes, often missing key entry points.
We solved this problem by developing an automatic algorithmic divergence screener. The Python-based software suite collects real-time quotes, processes financial dataframes, and outputs all found signals into a convenient online table on the website.
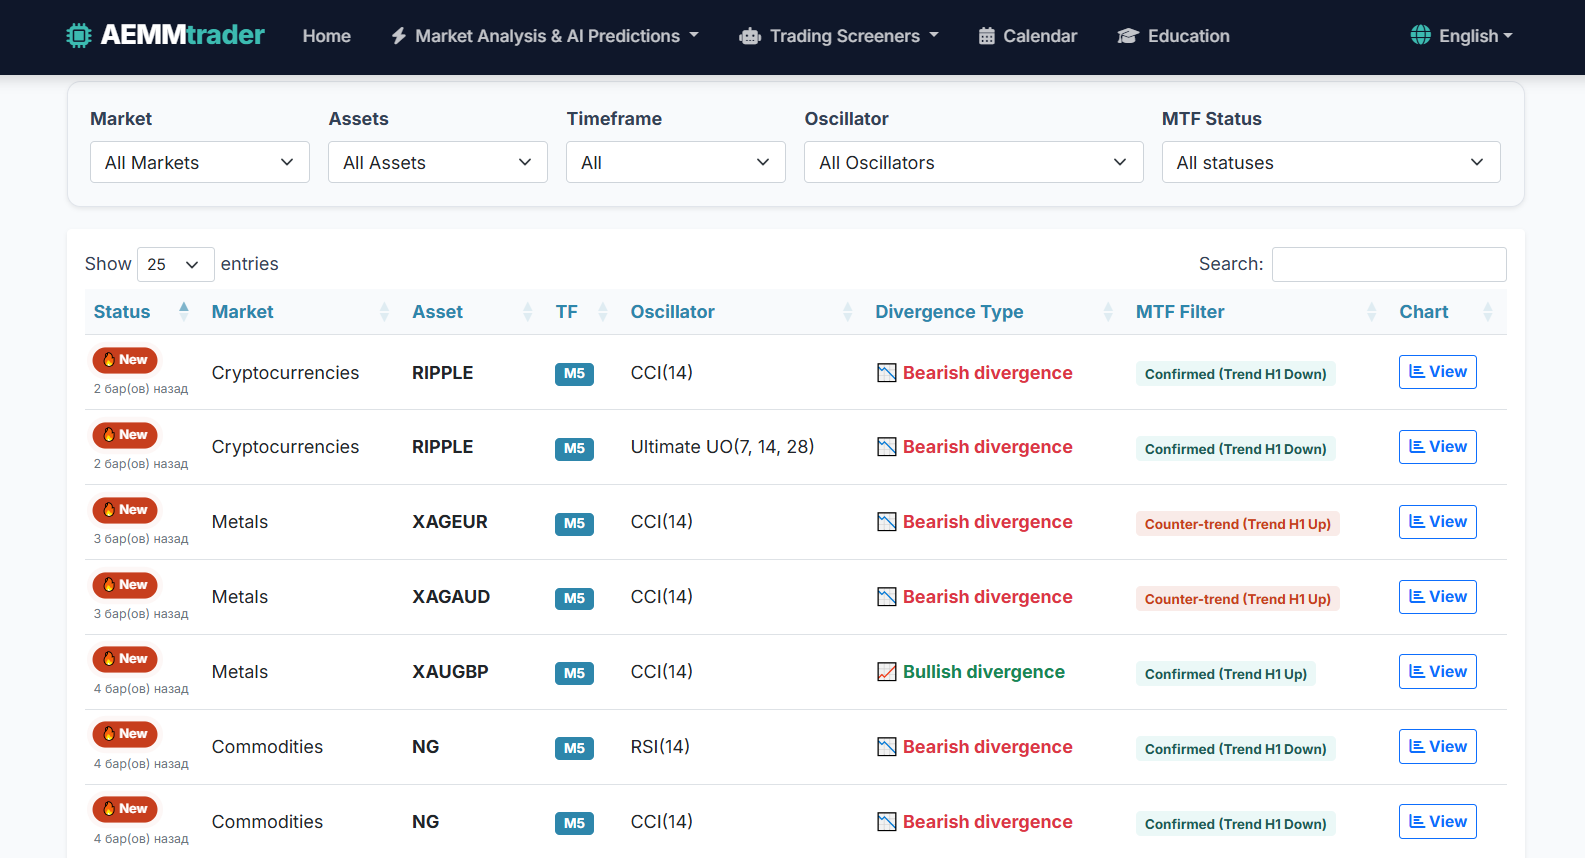
Key Screener Features:
- Multi-Asset Coverage: Continuous scanning of Forex markets, global Cryptocurrencies (Bitcoin, Ripple, Solana, etc.), Metals (XAUUSD, XAGEUR), and Energy Resources (NG, WTI).
- Timeframe Support: From intraday M5, M15, M30 to higher H1, H4, and D1.
- Intelligent MTF Filter (Multi-Timeframe): The screener algorithm automatically matches the found divergence with the higher timeframe trend (using an EMA filter). In the table, you immediately see the signal status: Confirmed (signal is confirmed by a higher trend) or Counter-trend (counter-trend signal requiring caution).
5. Practical Breakdown of a Real Trading Signal
Let's look at how the algorithm works with a specific example of Gold (XAUUSD H1) technical analysis using the RSI(14) indicator.
By clicking the "View" button in the table row, the trader gets a graphical visualization of the pattern and a calculated trading plan with stop-loss and take-profit levels.
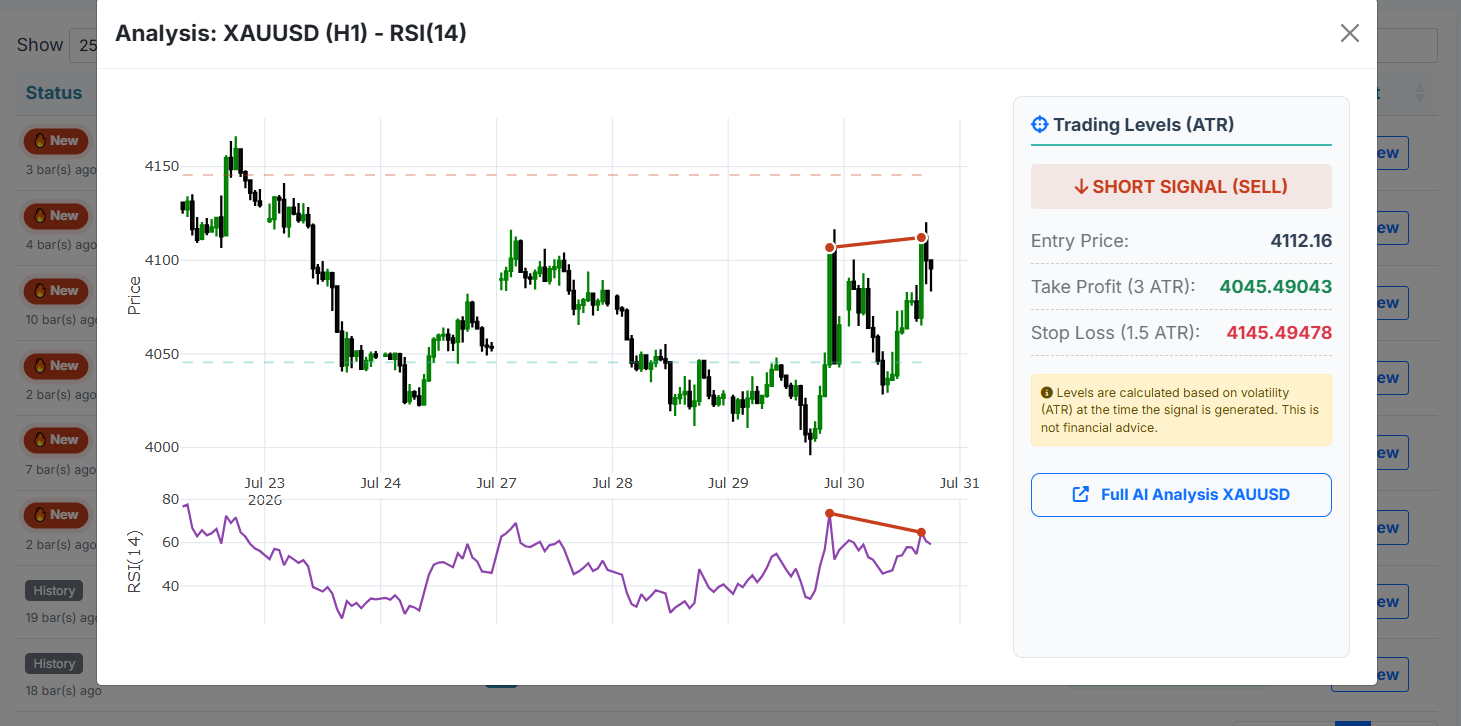
Signal Interpretation:
- Price Action: On the Gold chart, the price formed a new local high at
4112.16. - RSI(14) Readings: At the same time, the RSI oscillator printed a descending peak — a classic bearish divergence (SHORT signal).
- Automated Risk Management (ATR): The system instantly generates trading levels based on current market volatility (ATR indicator):
- Entry Price:
4112.16 - Take Profit (3 ATR):
4045.49— a potential profit-taking zone. - Stop Loss (1.5 ATR):
4145.49— a protective order placed beyond the last high.
- Entry Price:
Frequently Asked Questions (FAQ)
Which timeframes work best for divergences?
The most reliable signals form on timeframes from H1 (hourly) and above (H4, D1). Lower periods (M1, M5) produce a lot of market noise, so signals from the screener on M5 are best used in conjunction with the Confirmed status on the higher trend.
What is hidden divergence?
Hidden divergence indicates not a reversal, but a continuation of the trend. It occurs when the price forms a higher low, while the oscillator forms a lower low (in an uptrend). This is an excellent entry point in the direction of the global movement.
Can I trade solely based on one divergence?
Divergence is a strong signal, but entering the market is recommended only after additional confirmations. For example, a trendline breakout, the formation of a reversal candlestick pattern (e.g., a pin bar), or the presence of a strong support/resistance level.