RVI Oscillator: Complete Guide to Relative Vigor Index
Relative Vigor Index (RVI) is a unique oscillator developed by John Ehlers that combines price and volume analysis to assess trend strength. In this guide, we will break down the formula, signal interpretation, trading strategies, and combining RVI with other indicators.
1. What is the Relative Vigor Index (RVI)?
Relative Vigor Index (RVI) is a technical indicator developed by John Ehlers in 1995. Unlike many oscillators, RVI considers not only price change but also trading volume, making it especially valuable for assessing market "energy". The core idea of RVI is that in a bullish trend, closing prices are typically higher than opening prices, and in a bearish trend — vice versa, with volume confirming this dynamic.
RVI belongs to the oscillator class but has no fixed boundaries (unlike, for example, RSI). Its values fluctuate around the zero line, and it performs well in both trending and sideways markets.
A key advantage of RVI is its ability to detect hidden strength or weakness in a trend before it appears on the price chart, which is especially useful when looking for divergences.
"RVI is an indicator that measures not just speed but the 'energy' of a move. It helps you understand whether a rally is supported by genuine market participant interest."
2. Relative Vigor Index Calculation Formula
Calculating RVI occurs in several stages and considers open, close, high, and low prices for each period. The underlying assumption is that a strong trend is characterized not only by large price changes but also by significant volume.
2.1. Computing Numerator and Denominator
In the first stage, two values are calculated for each bar:
- Numerator = ((Close − Open) + 2 × (Closei-1 − Openi-1) + 2 × (Closei-2 − Openi-2) + (Closei-3 − Openi-3)) / 6
- Denominator = ((High − Low) + 2 × (Highi-1 − Lowi-1) + 2 × (Highi-2 − Lowi-2) + (Highi-3 − Lowi-3)) / 6
Triangular smoothing over 4 periods is used here to reduce noise.
2.2. Final RVI Formula
The actual Relative Vigor Index value is the ratio of the moving average of the numerator to the moving average of the denominator over a chosen period (usually 10):
where SMA(N) is the simple moving average over period N (default N = 10).
2.3. Signal Line
To generate trading signals, a signal line is added to RVI, which is typically a 4-period moving average of RVI.
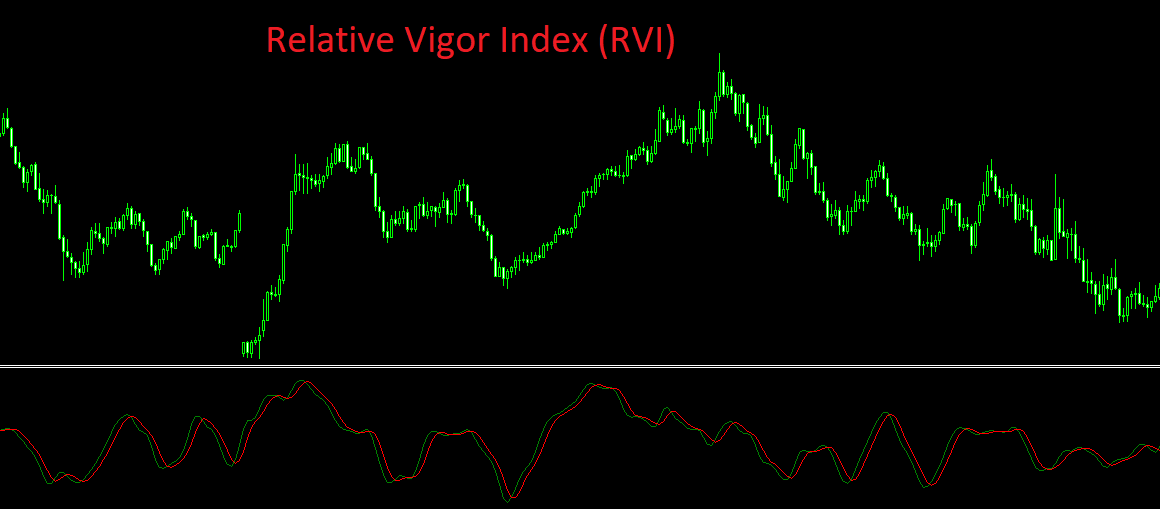
Visualization: RVI and its signal line below the price chart
3. Interpreting RVI Values
Since RVI oscillates around zero, its interpretation is intuitive:
- RVI > 0 — market sentiment is bullish. Closing prices are predominantly higher than opening prices, confirmed by volume.
- RVI < 0 — market sentiment is bearish. Closing prices are predominantly lower than opening prices.
The further the RVI value is from zero, the stronger the current momentum.
3.1. Assessing Trend Strength
RVI remaining in positive or negative territory for an extended period indicates trend strength. For example, if RVI stays above 0 for 20–30 candles, it confirms a stable uptrend.
3.2. Signal Line Crossovers
Classic signal: when RVI crosses its signal line (typically SMA(4)):
- Upward crossover — bullish signal, potential buy.
- Downward crossover — bearish signal, potential sell.
The reliability of these signals increases when they coincide with a breakout of key support/resistance levels.
4. RVI Divergences: Harbingers of Reversal
Like many oscillators, RVI is excellent for spotting divergences — discrepancies between price and indicator readings.
Bullish Divergence
Situation: Price makes a lower low, but RVI forms a higher low.
Meaning: Bearish momentum is fading despite the price decline. An upward reversal is expected.
Action: Prepare to buy after confirmation (e.g., breakout of local resistance).
Bearish Divergence
Situation: Price makes a higher high, but RVI forms a lower high.
Meaning: Bullish momentum is weakening. A downward reversal is expected.
Action: Prepare to sell after confirmation (e.g., breakout of local support).
Divergences on RVI are considered more reliable when they form on higher timeframes (H4, D1) and are accompanied by increasing volume in the direction of the expected reversal.
5. Practical Trading Strategies with RVI
5.1. Zero Line Crossover Strategy
A simple yet effective strategy: enter a position when RVI crosses the zero level. Crossing from negative to positive — buy signal; from positive to negative — sell signal. To filter false signals, wait for the candle where the crossover occurred to close.
5.2. RVI + Moving Averages
Combining RVI with a long-term moving average (e.g., EMA 200) helps filter out counter-trend signals:
- Price above EMA 200 — consider only bullish RVI signals (signal line upward crossover or exit from negative zone).
- Price below EMA 200 — consider only bearish RVI signals.
5.3. RVI and RSI Combination
Using two oscillators — RVI and RSI — provides more balanced signals. For example, if RVI crosses its signal line upward and RSI is above 50, it strengthens the bullish signal.
6. Pros and Cons of Relative Vigor Index
Pros
- Volume inclusion — RVI evaluates not only price but also market activity.
- Clear zero line — easy to determine current market sentiment.
- Versatility — works on all markets (forex, stocks, cryptocurrencies).
- Effective on divergences — provides quality reversal signals.
Cons
- Complex calculation — manual calculation is practically impossible, requires a platform.
- Signal lag — especially on lower timeframes.
- False signals in sideways markets — frequent signal line crossovers without follow-through.
How Technology Enhances RVI Analysis
Manually searching for divergences and tracking RVI signal line crossovers across many charts takes hours. The modern service AemmTrader automatically calculates RVI on all timeframes, detects bullish and bearish divergences, and delivers signals in real time.
The platform uses neural network ensembles that analyze the last 100 candles and run 30 Monte Carlo simulations to forecast movement. RVI signals are filtered through a multi-timeframe analysis matrix (from M5 to D1) and confirmed by a graphic pattern scanner. Dynamic Stop Loss and Take Profit levels are calculated based on the ATR indicator.
Using such tools, you focus on strategy, not routine. It's a bridge between amateur and professional approaches — saving time and increasing efficiency.