DEMA Indicator: Complete Guide to Double Exponential Moving Average
The Double Exponential Moving Average (DEMA) is an indicator developed by Patrick Mulloy to eliminate the lag inherent in regular EMAs. Thanks to double smoothing, DEMA reacts faster to price changes and provides more timely signals. In this guide, we will break down the formula, settings, trading strategies, and combining DEMA with other indicators.
1. What is the Double Exponential Moving Average (DEMA)?
Double Exponential Moving Average (DEMA) is a technical indicator created by Patrick Mulloy in 1994. Its primary goal is to reduce the lag inherent in regular exponential moving averages (EMA). While a standard EMA smooths price once, DEMA applies smoothing twice, allowing the line to follow price more closely and signal trend changes earlier.
DEMA belongs to the family of "fast" moving averages, alongside TEMA (Triple EMA). Unlike classic SMA and EMA, DEMA is better suited for short‑ to medium‑term trading where reaction speed matters. However, speed comes at the cost of increased sensitivity to market noise.
The indicator is universal and can be applied to any market: stocks, forex, cryptocurrencies. DEMA is often used as dynamic support/resistance levels, as well as in crossover systems with two DEMAs of different periods.
"DEMA is an attempt to get the best of both worlds: the smoothness of a moving average and minimal lag. For a trader who doesn't want to wait, it's an excellent choice."
2. Calculation Formula and Differences from EMA
The DEMA formula is as follows:
where:
- EMA1 — exponential moving average of the closing price over a chosen period n;
- EMA2 — exponential moving average of EMA1 (second‑order smoothing) over the same period n.
Essentially, DEMA doubles the weight of recent prices, compensating for the lag introduced by repeated smoothing. As a result, the DEMA line stays closer to the current price than a regular EMA with the same period.
2.1. Comparison with SMA and EMA
- SMA (Simple Moving Average): maximum lag, smoothest line.
- EMA (Exponential Moving Average): less lag, faster response to price.
- DEMA (Double Exponential Moving Average): minimal lag among the three, but more sensitive to noise.
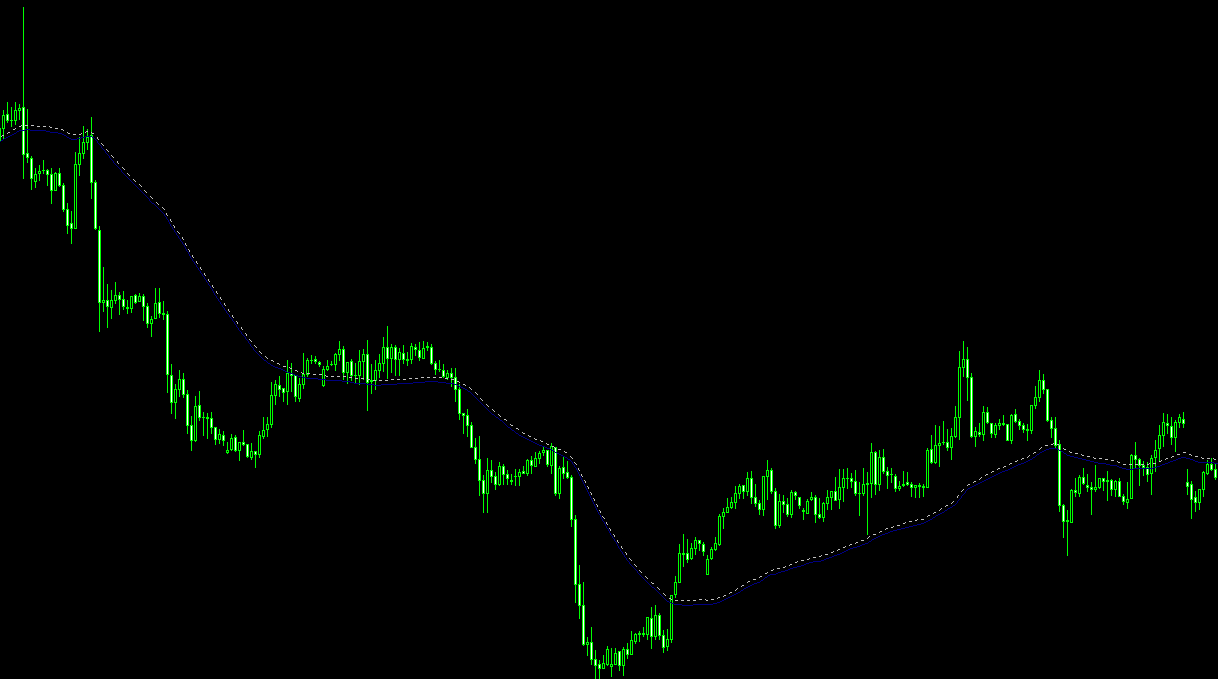
Visualization: DEMA (blue line) reacts faster to price reversals than a regular EMA (orange)
3. DEMA Signals and Trading Strategies
3.1. Two DEMA Crossovers
Classic strategy: use a fast DEMA (e.g., period 14) and a slow DEMA (period 50). Signals are generated when they cross:
- Bullish crossover: fast DEMA crosses above slow DEMA — buy signal.
- Bearish crossover: fast DEMA crosses below slow DEMA — sell signal.
Compared to EMA crossovers, DEMA signals appear earlier, allowing entry into a trend at a better price. However, in sideways markets, false signals may be more frequent.
3.2. DEMA as Dynamic Support and Resistance
Because DEMA stays close to price, it often acts as a dynamic level. In an uptrend, price bounces off DEMA upward; in a downtrend, it breaks downward. Strategy:
- Buy: during a pullback, price touches a rising DEMA and reverses upward. Enter on a confirming candle.
- Sell: during a downward correction, price tests a falling DEMA and bounces downward.
3.3. Combination with Oscillators
DEMA works well paired with RSI or Stochastic. For example, a buy signal is considered strong if price touches a rising DEMA while RSI is in oversold territory (below 30).
3.4. Multi‑Timeframe Analysis
Use DEMA on a higher timeframe (e.g., H4) to determine the overall trend, and on a lower timeframe (M15) to find entry points. If price is above DEMA(50) on H4, only look for buy setups on M15.
4. DEMA Parameter Settings
The choice of period depends on trading style and timeframe. Recommendations:
- Short‑term trading (M1‑M15): period 9–14. Fast reaction, but more false signals.
- Medium‑term (H1‑H4): period 20–30. Optimal balance of speed and reliability.
- Long‑term (D1 and above): period 50–100. Smooth following of the global trend.
A combination of DEMA(14) and DEMA(50) is often used for crossover signals. Parameters can be optimized for a specific instrument through historical testing.
5. Pros and Cons of DEMA
Pros
- Minimal lag — signals arrive faster than with EMA and SMA.
- Clear support/resistance levels — DEMA often serves as a reversal point.
- Versatility — works on all markets and timeframes.
- Good compatibility — excellent trend filter for oscillators.
Cons
- Increased sensitivity — more false signals in sideways markets.
- Difficult manual calculation — requires automation.
- Needs filtering — can produce a lot of noise on its own.
Automated DEMA Analysis with AemmTrader
Manually tracking fast and slow DEMA crossovers, bounces from levels, and combinations with oscillators across dozens of instruments is a labor‑intensive task. The AemmTrader service is an intelligent platform for real‑time market analysis. We use neural network ensembles, automatic pattern recognition, and advanced technical analysis algorithms to give you a statistical edge.
Heart of the System: Neural Network Ensemble. We don't trust a single indicator. AEMMtrader's forecast is the result of consensus among dozens of independent mathematical models analyzing a window of the last 100 candles.
With AemmTrader, you only see those moments when the market is truly ready for a strong move. This saves time and increases your trading efficiency.