Standard Deviation: Complete Guide to Volatility Analysis in Trading
Standard Deviation is a fundamental statistical indicator that measures volatility and price dispersion around the mean. In this guide we will break down the formula, value interpretation, risk management applications, and trading strategies using Standard Deviation.
1. What is Standard Deviation?
Standard Deviation is a statistical measure that quantifies the amount of variation or dispersion of a set of values relative to their arithmetic mean. In trading, this indicator is used to gauge volatility: the higher the standard deviation, the more the price deviates from its average level, indicating high market instability and potential risks.
The concept of standard deviation was first introduced by English statistician Karl Pearson in the 19th century, but it gained widespread use in financial analysis in the second half of the 20th century. Today, Standard Deviation is part of every trader's basic toolkit for working with risk and volatility. Unlike indicators that show trend direction (SMA, EMA) or momentum (RSI, Stochastic), Standard Deviation focuses solely on the magnitude of price fluctuations.
This indicator is especially useful for assessing market risk and adapting trading strategies to current conditions. For example, during periods of low volatility a trader may prefer accumulation strategies, while a sharp rise in standard deviation might prompt a shift to aggressive trading or tighter stop-losses.
"Standard deviation is not just a number; it is the language through which the market speaks about its condition. The ability to read volatility separates the professional from the amateur."
2. Standard Deviation Calculation Formula
Standard deviation for a price series is calculated using the classic statistical formula. First, the mean value (μ) of prices over a chosen period is computed, then the squared deviations of each price from the mean are summed and divided by the number of observations (N). The square root of this variance gives the standard deviation.
where:
- σ — standard deviation;
- xi — price value (usually closing price) for the i‑th period;
- μ — arithmetic mean of prices over N periods;
- N — number of periods (e.g., 20 candles).
In most trading platforms, Standard Deviation is automatically calculated for a given period. The default period is 20 (one month of trading days). Increasing the period makes the indicator smoother but less sensitive to short‑term volatility spikes.
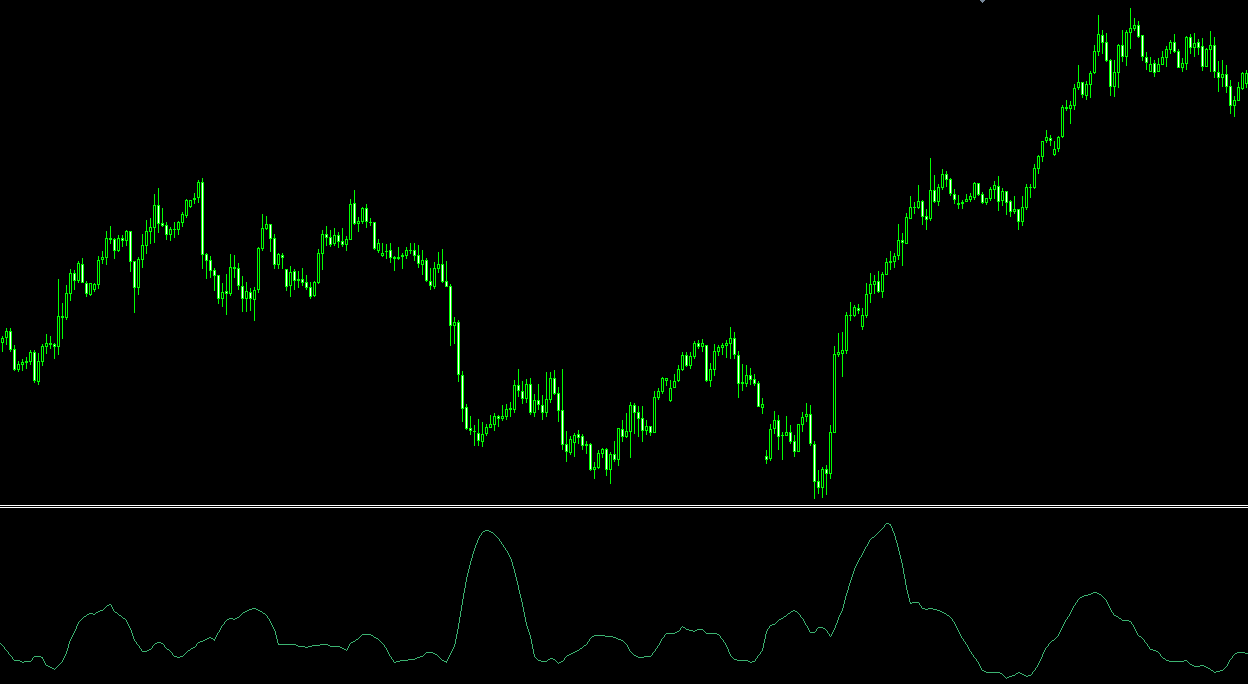
Visualization: an increase in standard deviation corresponds to higher volatility
3. Applying Standard Deviation in Trading
3.1. Assessing Market Volatility and Choosing a Strategy
Low standard deviation indicates a calm market with small price swings. In such periods, traders may prefer accumulation strategies or range trading. High standard deviation, on the contrary, signals elevated volatility, creating opportunities for scalping, breakout trading, and the use of wider stop‑losses.
3.2. Setting Dynamic Stop‑Loss and Take‑Profit Levels
Standard deviation values allow a trader to set stop‑loss and take‑profit levels adapted to current volatility. For instance, a stop‑loss can be placed at a distance of 2σ (two standard deviations) from the entry price. In 95% of cases (under a normal distribution), price should not breach ±2σ, providing a statistically grounded protection level.
3.3. Identifying Potential Reversals
A sharp increase in standard deviation often precedes major moves or reversals. If after a prolonged period of low volatility the Standard Deviation begins to rise, it may signal the emergence of a new trend. Traders use such moments to enter the market in the direction of the breakout.
3.4. Portfolio Analysis and Diversification
Standard deviation is used to assess the riskiness of individual assets and entire portfolios. By comparing the volatility of different instruments, a trader can balance the portfolio by including both high‑volatility assets for potentially higher returns and low‑volatility ones for stability.
4. Trading Strategies and Standard Deviation Settings
4.1. Choosing the Calculation Period
- Short period (5–10): high sensitivity, suitable for scalping and intraday trading. Provides more signals but increases false triggers.
- Medium period (14–20): optimal balance for most strategies (default is 20).
- Long period (30–50): smooth line, suitable for long‑term analysis and assessing overall asset volatility.
4.2. Volatility Bands Strategy
Constructing volatility bands is similar to Bollinger Bands but without the middle line. Upper band = average price + k × σ, lower band = average price − k × σ. A trader can open positions when price moves outside the bands, aiming for a reversion to the mean.
4.3. Filter for Trend Strategies
Before entering a trend trade (e.g., based on MACD or Parabolic SAR), check the standard deviation. If it is above a certain threshold (e.g., above its 20‑period average), this confirms that the trend is accompanied by sufficient volatility and has movement potential.
5. Pros and Limitations of Standard Deviation
Pros
- Objective risk assessment — quantitative measurement of volatility.
- Versatility — applicable to any asset and timeframe.
- Foundation for other indicators — Bollinger Bands, ATR (partially), etc. use standard deviation.
- Risk management aid — allows justified stop‑loss placement.
Limitations
- Does not show direction — only the magnitude of fluctuations.
- Assumes normal distribution — financial markets often exhibit "fat tails" beyond σ.
- Lagging nature — reacts to changes in volatility that have already occurred.
- Does not forecast future volatility — shows current historical volatility.
Automated Volatility Analysis with AemmTrader
Manually tracking standard deviation across dozens of instruments and timely spotting volatility spikes is a labor‑intensive task. The AemmTrader service is an intelligent platform for real‑time market analysis. We use neural network ensembles, automatic pattern recognition, and advanced technical analysis algorithms to give you a statistical edge.
Heart of the System: Neural Network Ensemble. We don't trust a single indicator. AEMMtrader's forecast is the result of consensus among dozens of independent mathematical models analyzing a window of the last 100 candles. Standard deviation is used in combination with other metrics to assess the probability of strong moves and to calculate optimal risk levels.
With AemmTrader you see only those moments when the market is truly ready for a strong move. This saves time and increases your trading efficiency.