Ichimoku Kinko Hyo: Complete Guide to the Ichimoku Cloud
Ichimoku Kinko Hyo (Ichimoku Cloud) is a unique indicator created by Japanese journalist Goichi Hosoda in the 1930s. It combines five lines and a "cloud" to provide comprehensive trend analysis, support/resistance levels, and trade signals. In this guide, we will break down the components, settings, and practical strategies with Ichimoku.
1. What is Ichimoku Kinko Hyo?
Ichimoku Kinko Hyo (Ichimoku Cloud) is a technical indicator developed by Goichi Hosoda (pen name Sanjin Ikeda) in Japan in the 1930s. The name translates to "one glance equilibrium chart," reflecting its essence: with a single look at the chart, a trader can assess trend, momentum strength, support and resistance levels, and obtain trade signals.
Unlike most indicators, Ichimoku does not merely follow price; it projects future support and resistance levels using a forward‑shifted "cloud" (Kumo). This makes it particularly valuable for forecasting market dynamics. The indicator works well on any market—stocks, forex, cryptocurrencies—and on higher timeframes (H1, H4, D1).
Ichimoku is often combined with other tools, such as the RSI for signal filtering or moving averages for trend confirmation.
"Ichimoku is more than an indicator; it is a philosophy of balance. It teaches you to see the market as a whole, not in fragments."
2. Ichimoku Components
Ichimoku consists of five lines that together form a complete market picture. Standard settings: 9, 26, 52—based on historical Japanese trading periods.
2.1. Tenkan‑sen (Turning Line)
A short‑term line reflecting short‑term momentum:
2.2. Kijun‑sen (Standard Line)
A medium‑term line showing the primary trend and acting as dynamic support/resistance:
2.3. Senkou Span A (Leading Span A)
The average of Tenkan‑sen and Kijun‑sen, shifted forward by 26 periods:
2.4. Senkou Span B (Leading Span B)
The average of the highest high and lowest low over 52 periods, shifted forward by 26:
2.5. Chikou Span (Lagging Span)
The current closing price, shifted backward by 26 periods:
2.6. The Cloud (Kumo)
The space between Senkou Span A and Senkou Span B forms the "cloud" (Kumo). If Senkou Span A is above Senkou Span B, the cloud is bullish (typically green); if below, bearish (typically red). The cloud serves as a future support/resistance zone.
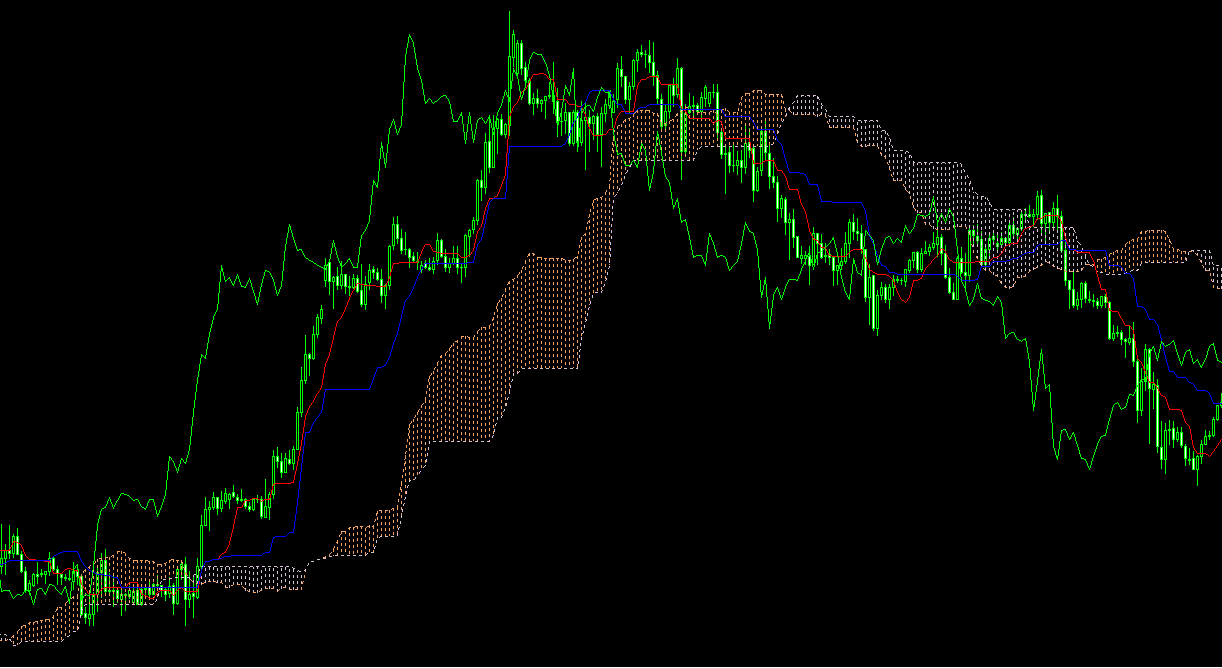
Visualization: all Ichimoku components on one chart
3. Ichimoku Signals and Trading Strategies
3.1. Determining the Trend
- Bullish trend: price above the cloud, Tenkan‑sen above Kijun‑sen, Chikou Span above price 26 periods ago.
- Bearish trend: price below the cloud, Tenkan‑sen below Kijun‑sen, Chikou Span below price 26 periods ago.
- Sideways: price inside the cloud, lines intertwined.
3.2. Tenkan‑sen / Kijun‑sen Cross (TK Cross)
A classic signal similar to a fast/slow moving average crossover:
- Bullish signal: Tenkan‑sen crosses above Kijun‑sen. Reliability is higher if the crossover occurs above the cloud.
- Bearish signal: Tenkan‑sen crosses below Kijun‑sen. Reliability is higher if the crossover occurs below the cloud.
3.3. Kumo (Cloud) Signals
- Cloud breakout: price breaking out of the cloud upward—bullish signal; downward—bearish signal.
- Cloud color change: shift from red to green—strengthening bullish trend; from green to red—strengthening bearish trend.
- Cloud thickness: thick cloud—strong support/resistance; thin cloud—weak.
3.4. "Three Signals" Strategy
A comprehensive approach: open a position only when three conditions align:
- Price is on one side of the cloud (trend defined).
- Tenkan‑sen and Kijun‑sen have crossed in the direction of the trend.
- Chikou Span confirms the move (above/below price 26 periods ago).
3.5. Combining with RSI
To filter false signals: enter a buy based on Ichimoku only if RSI is above 50 (confirmation of bull strength), and a sell only if RSI is below 50.
4. Pros and Cons of Ichimoku
Pros
- Comprehensive analysis — one indicator replaces several.
- Future level projection — the cloud is shifted forward.
- Clear trend definition — based on price position relative to the cloud.
- Versatility — works on all markets and timeframes.
Cons
- Complex for beginners — many lines, requires time to master.
- Lag — signals may be delayed on lower timeframes.
- Settings dependency — standard periods (9,26,52) may not suit all instruments.
5. Advanced Ichimoku Techniques
5.1. Cloud Thickness and Slope Analysis
A thick cloud indicates strong support/resistance and high future volatility. A thin cloud is easily broken. An upward/downward sloping cloud confirms trend direction.
5.2. Chikou Span Interaction with Price
When Chikou Span crosses the price chart from below—bullish signal; from above—bearish signal. It is also important whether Chikou Span is above or below the cloud.
5.3. Multi‑Timeframe Analysis
On a higher timeframe (D1), determine the global trend using the cloud. On a lower timeframe (H1), look for entry points via Tenkan/Kijun crossovers in the direction of the global trend.
Automated Ichimoku Analysis with AemmTrader
Manually tracking Tenkan/Kijun crossovers, cloud breakouts, and Chikou Span signals across dozens of instruments is a task requiring intense focus. The AemmTrader service is an intelligent platform for real‑time market analysis. We use neural network ensembles, automatic pattern recognition, and advanced technical analysis algorithms to give you a statistical edge.
Heart of the System: Neural Network Ensemble. We don't trust a single indicator. AEMMtrader's forecast is the result of consensus among dozens of independent mathematical models analyzing a window of the last 100 candles. Ichimoku signals are filtered through multi‑timeframe analysis and confirmed by a graphic pattern scanner.
With AemmTrader, you only see those moments when the market is truly ready for a strong move. This saves time and increases your trading efficiency.