One‑Day Patterns in Technical Analysis: Gaps, Spikes, Reversal and Thrust Days
One‑day patterns are the simplest graphic patterns to identify, forming within a single trading day. They include gaps, spikes, reversal days, thrust days, wide‑ranging days and others. In this guide we will cover each type, learn to distinguish significant signals from false ones, and apply them in real trading.
1. Gaps
A gap is a price interval between the close of one trading day and the open of the next, when the current day’s low is higher than the previous day’s high (gap up) or the current day’s high is lower than the previous day’s low (gap down). Gaps occur due to important events happening when the exchange is closed: macroeconomic data releases, corporate reports, geopolitical news. On a 24‑hour market such sharp jumps would not exist.
Gaps can be both powerful trading signals and sources of false moves. The ability to distinguish their types is the key to successful gap trading.
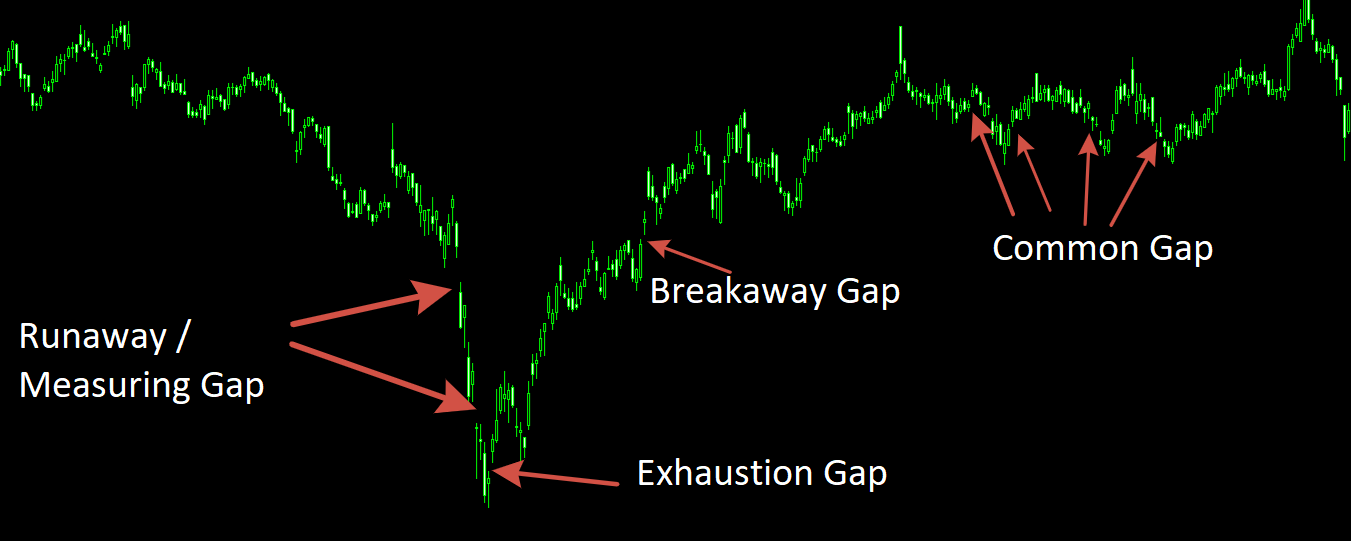
1.1. Common Gap
A common gap appears inside a trading range, has no special meaning and is usually filled quickly. Such gaps are typical for low‑liquidity markets or consolidation periods. Trading against a common gap expecting it to fill is a common scalping strategy.
1.2. Breakaway Gap
A breakaway gap occurs when price exits a long trading range (consolidation pattern, triangle, flag). It is accompanied by a volume spike and serves as a powerful signal of a new trend beginning. If the gap remains open for several days, it becomes one of the most reliable continuation patterns.
1.3. Runaway / Measuring Gap
A runaway gap appears in the middle of a strong trend and indicates its acceleration. Often it follows a significant price move and points to a “second breath” of the trend. Such gaps are used to add to positions – traders increase their volume in the direction of the move.
1.4. Exhaustion Gap
An exhaustion gap forms after a long and sharp price move, right before a trend reversal. It can be distinguished from a runaway gap only in hindsight – by subsequent price action. If the gap is filled within 1‑3 days and price reverses, it was an exhaustion signal. Trading against an exhaustion gap requires caution and a clear stop‑loss.
1.5. Gap filling and trading rules
According to classic technical analysis, most gaps eventually get filled (price returns to the pre‑gap level). However, significant gaps (breakaway and runaway) may stay open for years. Basic gap trading rules:
- Common gap – trade against it expecting a fill, but exit quickly.
- Breakaway gap – enter immediately at market or on a retest of the gap edge. Stop beyond the opposite side of the range.
- Runaway gap – add to your position in the trend direction.
- Exhaustion gap – wait for reversal confirmation (e.g., a candle close beyond the gap) and then enter against the trend.
«A gap is not just an empty space on the chart. It is the footprint of crowd emotion, which can either bring quick profit or destroy your deposit if you do not understand its nature.»
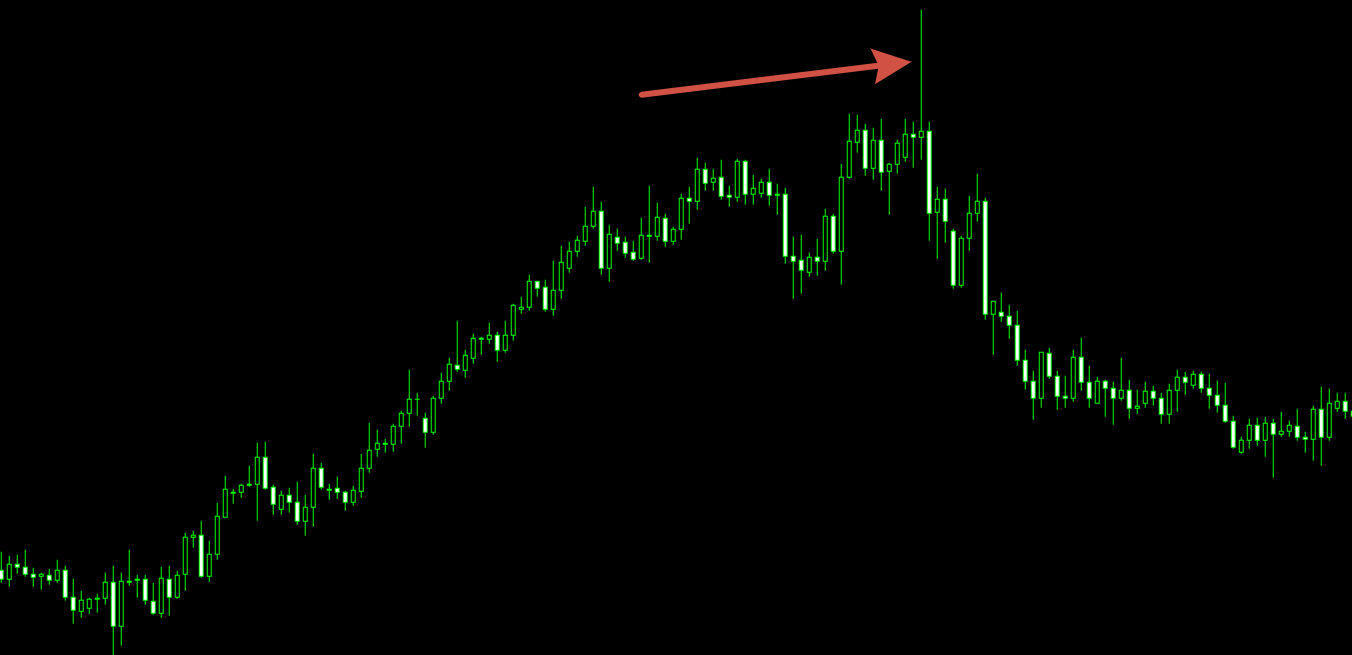
2. Spikes
Upward spike (upper spike) – a daily high that significantly exceeds the highs of the preceding and following days. Often the closing price on such a day is near the bottom of the day’s range. An upward spike is meaningful if it forms after a prolonged rise – it indicates a temporary climax of buying and may be a potential top.
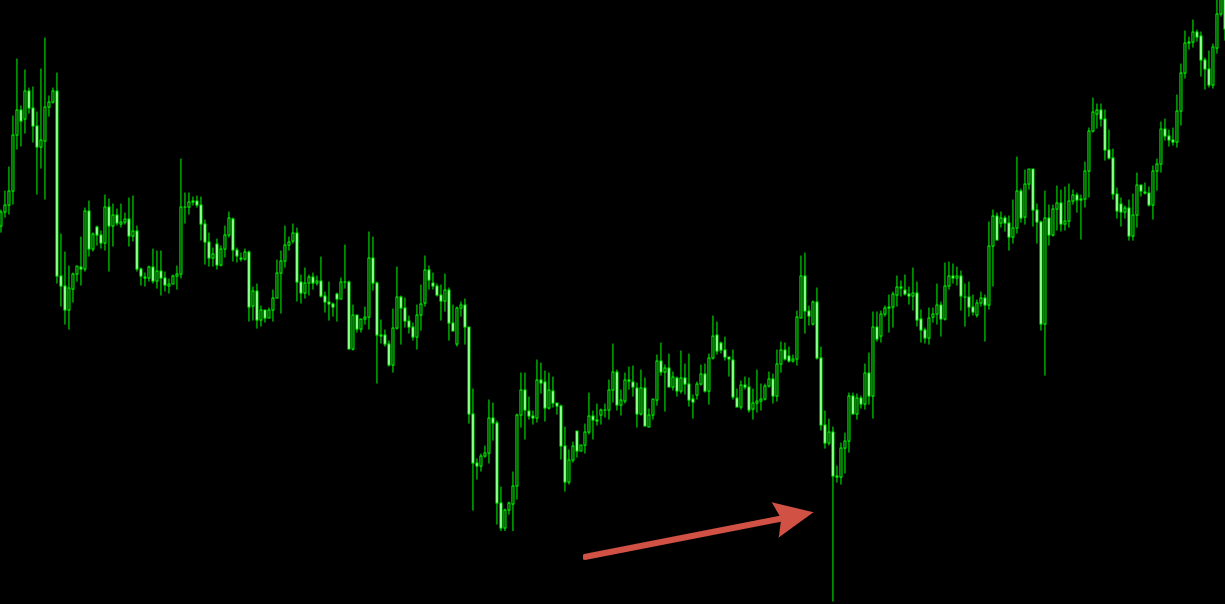
Downward spike (lower spike) – similarly, a daily low that is noticeably lower than neighbouring lows, with the close near the top of the day’s range. It forms after a fall and often signals a temporary exhaustion of sellers.
The significance of a spike is enhanced by three factors: (1) large difference from neighbouring extremes, (2) closing at the opposite end of the day’s range, (3) a strong preceding move in the same direction. Such spikes often become key reversal points.
Spikes can be used to set stop‑losses (just above/below the spike) or to enter against the previous trend after confirmation (e.g., the next candle closes beyond the spike).
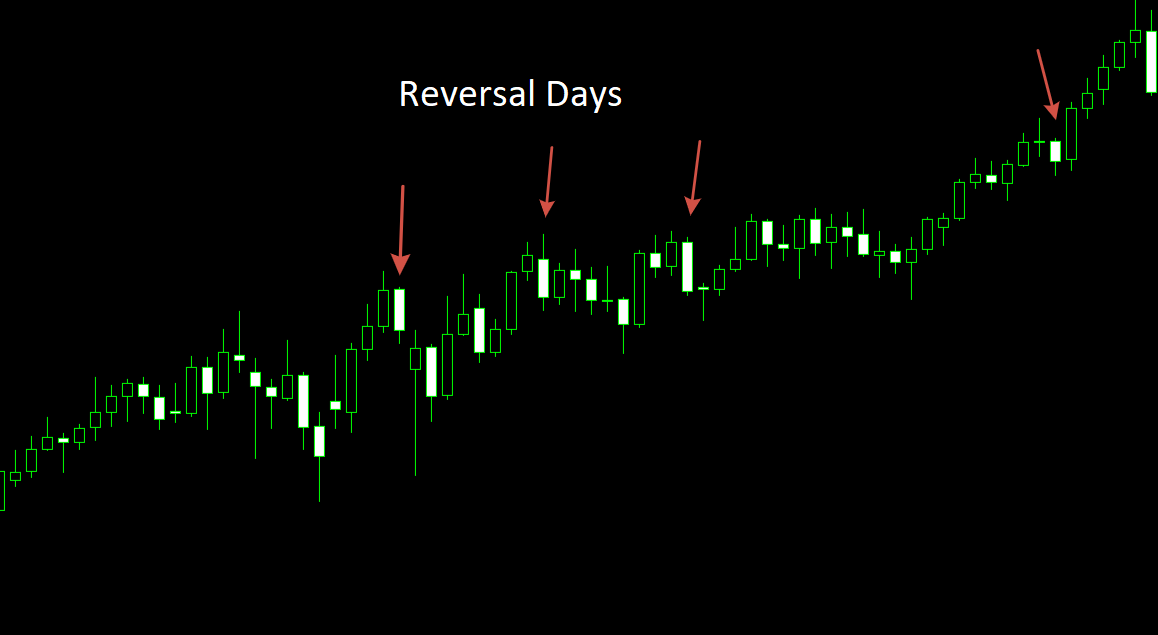
3. Reversal Days
Reversal high day – a day when price first makes a new high, then reverses and closes below the previous day’s close. Reversal low day – similarly, a new low, then a reversal up and a close above the previous day’s close.
The standard definition is too loose and generates many false signals. To increase reliability, traders tighten the conditions: the close must be not just below the previous close, but below the previous day’s low (for a reversal high), or above the previous day’s high (for a reversal low). Such “strong reversal days” occur less frequently, but their predictive value is much higher.
How to trade: after a confirmed reversal high day (close below the previous day’s low), you can open a short position with a stop above that day’s high. Similarly for a reversal low day – a long position with a stop below that day’s low.
«Not every reversal day becomes a real reversal. But if you wait for confirmation – a close beyond the previous day’s range – the accuracy of signals increases many times over.»
4. Thrust Days
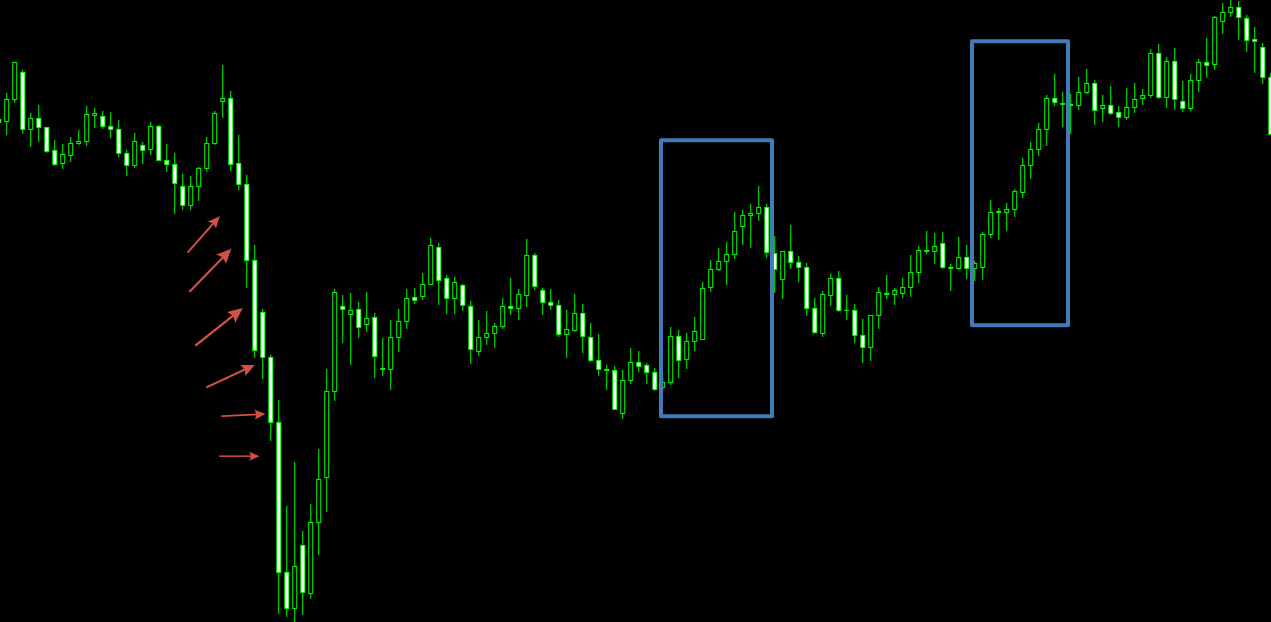
Upward thrust day – a day when the close is above the previous day’s high. Downward thrust day – a close below the previous day’s low. This is the simplest way to assess trend strength: a sequence of consecutive upward thrust days indicates a strong upward move, while a sequence of downward thrust days indicates a strong downward move.
A single thrust day is not a significant signal because such days occur often. But when there are 3 or more consecutive upward thrust days, it is a sign of a sustainable bullish impulse. In a sideways market, the number of upward and downward thrust days is roughly equal.
Practical application: if after a series of upward thrust days a downward thrust day appears, it may be the first signal of trend weakening. Combined with other indicators (RSI, volume), you can look for exit points.
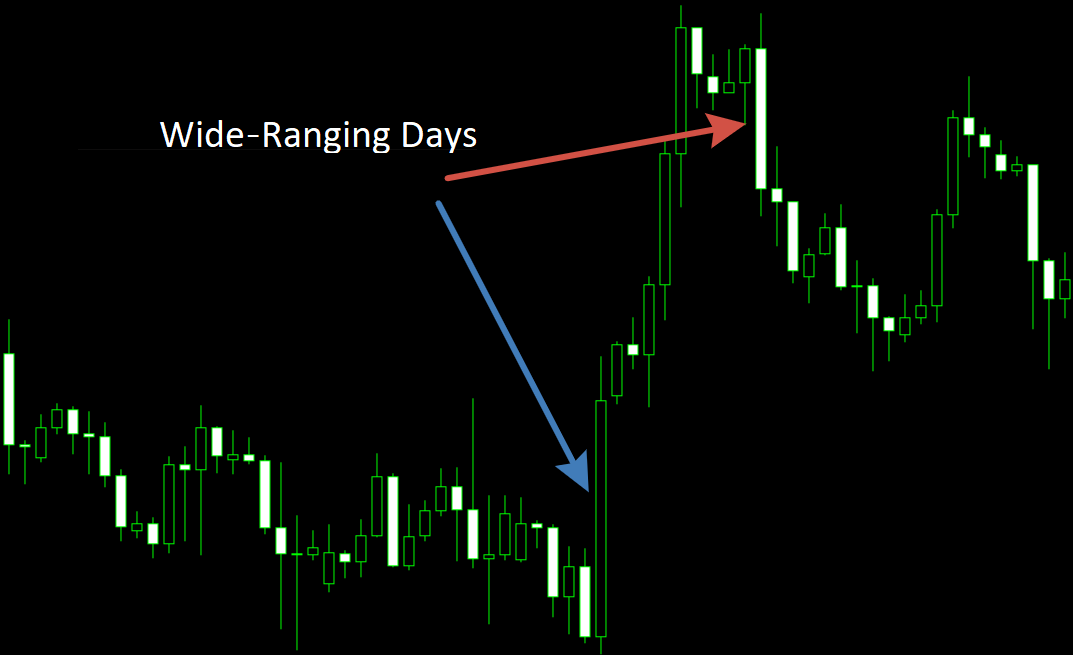
5. Wide‑Ranging Days
A wide‑ranging day is a day whose volatility significantly exceeds the average volatility of the previous 10‑20 trading days. Such a day often becomes a turning point or an acceleration point.
Rule: if a wide‑ranging day occurs after a prolonged decline and closes in the upper third of its range – it is a reversal‑up signal. If after a prolonged rise and closes in the lower third – a reversal‑down signal. Days with an extreme range (2‑3 times the average) should be treated as a serious warning of a trend change.
To objectively assess width, you can use the ATR indicator (Average True Range). A day is considered wide‑ranging if its true range exceeds ATR(14) by 1.5‑2 times.