Stochastic Oscillator: Complete Guide to Stochastic
The Stochastic Oscillator is one of the most popular indicators, created by George Lane in the 1950s. It measures the position of the closing price relative to the high-low range over a chosen period. In this guide, we will break down the formula, interpretation of %K and %D lines, divergence signals, and practical trading strategies.
1. What is the Stochastic Oscillator?
The Stochastic Oscillator is an indicator developed by George Lane in the late 1950s. It compares the current closing price to the price range over a specified period to assess market momentum. The core idea: in an uptrend, closing prices tend toward the upper end of the range; in a downtrend, toward the lower end. When the trend loses strength, the closing price begins to drift away from the range boundaries, signaling a possible reversal.
Stochastic is expressed as a percentage from 0 to 100. Values above 80 typically indicate overbought conditions, while values below 20 indicate oversold conditions. However, in a strong trend, the indicator can remain in these zones for extended periods, so line crossovers and divergences are key.
Unlike the RSI, which smooths data, Stochastic is more sensitive to recent price movements, making it preferable for short-term trading. It pairs well with trend indicators such as moving averages and support/resistance levels.
"Stochastic measures not just price, but the speed of its change. It tells us when bulls or bears are losing control of the move."
2. Calculation Formula and Components
Stochastic consists of two lines: the fast %K and the slow %D. Initially, Lane proposed the "fast" stochastic, but traders later adopted the smoothed "slow" version as more reliable.
2.1. Fast Stochastic (%K and %D)
The formula for calculating the fast %K line (over n periods, usually 14):
where:
- C — latest closing price,
- Ln — lowest price over n periods,
- Hn — highest price over n periods.
The %D line in the fast stochastic is a simple moving average (usually 3-period) of %K:
2.2. Slow Stochastic
The fast stochastic often produces many false signals due to its high sensitivity. Therefore, most traders use the "slow" version, in which:
- New %K (slow) = old %D (fast),
- New %D (slow) = 3-period SMA of the new %K.
Thus, the slow stochastic consists of twice-smoothed lines: a solid %K and a dotted %D. This is the version found by default in most trading platforms.
Standard settings: 14 periods for calculation, 3 periods for smoothing %K, and 3 for %D. Overbought and oversold levels are usually set at 80 and 20 (rather than 70/30 for RSI) due to the indicator's higher volatility.
3. Interpreting Stochastic Signals
3.1. Overbought and Oversold Zones
Classic levels for the slow stochastic:
- Above 80 — overbought zone. Price is near the upper boundary of the recent range. A downward correction is possible.
- Below 20 — oversold zone. Price is near the lower boundary of the range. An upward bounce is possible.
However, as with RSI, in a strong trend the stochastic can remain in extreme zones for an extended period. Therefore, exits from these zones or line crossovers are considered more reliable signals.
3.2. %K and %D Line Crossovers
The crossover of the fast %K line and the slow %D line generates trading signals:
- Buy: The %K line crosses above the %D line in the oversold zone (below 20) and rises above 20.
- Sell: The %K line crosses below the %D line in the overbought zone (above 80) and falls below 80.
Signal reliability increases if the crossover occurs after a divergence has formed or coincides with a price level breakout.
4. Stochastic Divergences: Harbingers of Reversal
Divergence is a discrepancy between the direction of price and the direction of the oscillator. Stochastic is excellent for spotting divergences, especially on higher timeframes.
Bullish Divergence
Situation: Price makes a lower low, but stochastic forms a higher low.
Meaning: Bearish momentum is fading. Expect an upward reversal.
Action: Prepare to buy; enter after %K crosses above %D.
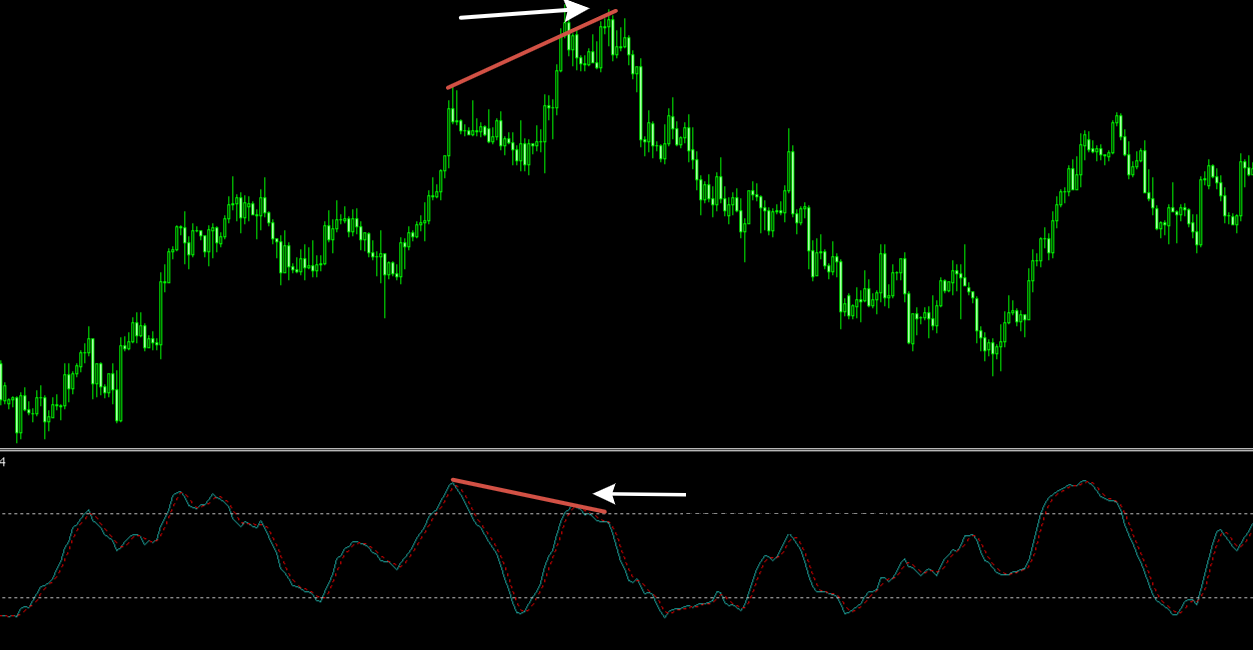
Bearish Divergence
Situation: Price makes a higher high, but stochastic forms a lower high.
Meaning: Bullish momentum is weakening. Expect a downward reversal.
Action: Prepare to sell; enter after %K crosses below %D.
Example of bullish divergence: price falls, stochastic rises
Example of bearish divergence: price rises, stochastic falls
Divergence reliability increases when they form on higher timeframes (H4, D1) and are confirmed by other indicators such as MACD or CCI.
5. Practical Trading Strategies with Stochastic
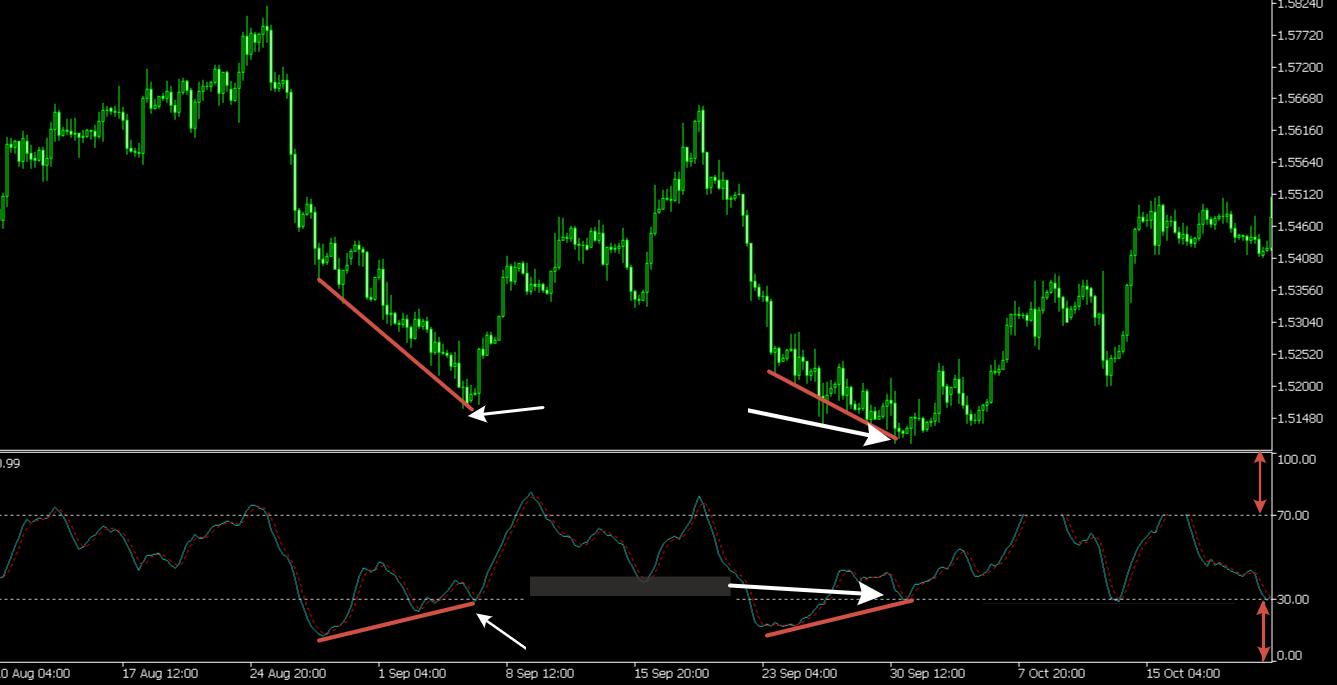
5.1. Line Crossover in Zones Strategy
Classic approach: wait for stochastic to enter the overbought (>80) or oversold (<20) zone, then wait for the %K and %D lines to cross in the opposite direction.
- Buy signal: %K and %D fall below 20, then %K crosses above %D and rises above 20. Enter on the close of the signal candle. Stop-loss beyond the nearest low.
- Sell signal: %K and %D rise above 80, then %K crosses below %D and falls below 80. Enter on the close of the signal candle. Stop-loss beyond the nearest high.
5.2. Stochastic + Trend Filter (EMA 200)
To avoid false counter-trend signals, add a 200-period exponential moving average (EMA 200):
- Price above EMA 200 — uptrend. Consider only buy signals (exiting oversold zone or bullish crossovers).
- Price below EMA 200 — downtrend. Consider only sell signals (exiting overbought zone or bearish crossovers).
5.3. Stochastic + RSI: Double Confirmation
Combining two oscillators — Stochastic and RSI — provides more reliable signals. For example, a buy signal is considered strong if both indicators simultaneously exit oversold zones (Stochastic above 20, RSI above 30) and form a bullish crossover.
"Stochastic is like a market thermometer. It doesn't tell you where price will go, but it shows when the market is 'overheated' or 'oversold'. Use it in conjunction with trend analysis."
6. Pros and Cons of Stochastic
Pros
- High sensitivity — reacts quickly to price changes, ideal for scalping and day trading.
- Clear signals — %K and %D crossovers are easy to identify.
- Effective on divergences — provides strong leading reversal signals.
- Versatility — works on all markets and timeframes.
Cons
- False signals in sideways markets — frequent line crossovers without strong movement.
- Extended stays in zones — can remain overbought/oversold for long periods in strong trends.
- Requires confirmation — rarely used in isolation; needs additional filters.
Stochastic Without the Grind: Let Algorithms Analyze
Tracking %K and %D crossovers, searching for hidden divergences, and waiting for exits from overbought/oversold zones across dozens of instruments is a time-consuming task. The AemmTrader service takes on this burden. Its algorithms scan charts around the clock, instantly highlighting moments when stochastic provides the most significant signals.
Unlike the standard line display in a trading terminal, AemmTrader analyzes stochastic behavior comprehensively: it considers readings on different timeframes (from M5 to D1), checks whether the signal coincides with graphic patterns, and calculates stop-loss and take-profit levels based on current market volatility. You receive not just an indicator, but a ready trade idea with calculated risks.
Stop spending hours on mechanical signal hunting. Focus on decision-making and entrust the technical work to the platform. This is not a replacement for your experience, but an enhancement through speed and computational accuracy.