Williams %R Oscillator: Complete Guide to Percent Range
Williams Percent Range (%R) is an indicator developed by legendary trader Larry Williams. It shows the position of the closing price relative to the high‑low range over a chosen period. In this guide, we will break down the formula, signal interpretation, trading strategies, and combining %R with other indicators.
1. What is Williams Percent Range (%R)?
Williams Percent Range (%R) is a technical oscillator created by Larry Williams that measures the position of the latest closing price relative to the high and low over a specified period. In essence, it is a mirror image of the fast stochastic (%K) but with an inverted scale: values fluctuate from 0 to –100, where levels above –20 are considered overbought, and below –80 oversold.
Unlike the RSI, which smooths data, and the Stochastic, which uses two lines, Williams %R is a single line that is very sensitive to price movements. This makes %R excellent for spotting short‑term extremes and divergences.
The indicator is universal: it can be applied to any market (stocks, forex, cryptocurrencies) and timeframe. However, due to its high sensitivity, it is recommended to combine it with trend filters, such as moving averages or support/resistance levels.
“Williams %R is the market's speedometer. It doesn't tell you where to go, but it shows when you're going too fast and need to slow down.”
2. Williams %R Calculation Formula
The calculation of Williams %R is very simple and similar to the formula for the fast %K line of the stochastic, but with a negative sign and multiplied by –100:
where:
- Highest High — the highest price over the chosen period (usually 14),
- Lowest Low — the lowest price over the same period,
- Close — the closing price of the current candle.
If the closing price equals the period's high, %R is 0 (top of the range). If the closing price equals the period's low, %R is –100 (bottom of the range). Thus, the indicator always stays between 0 and –100.
The standard calculation period is 14 (default in many platforms). A shorter period (e.g., 7 or 9) makes the indicator more sensitive but increases false signals. A longer period (21 or 28) smooths the line, making signals rarer and more reliable.
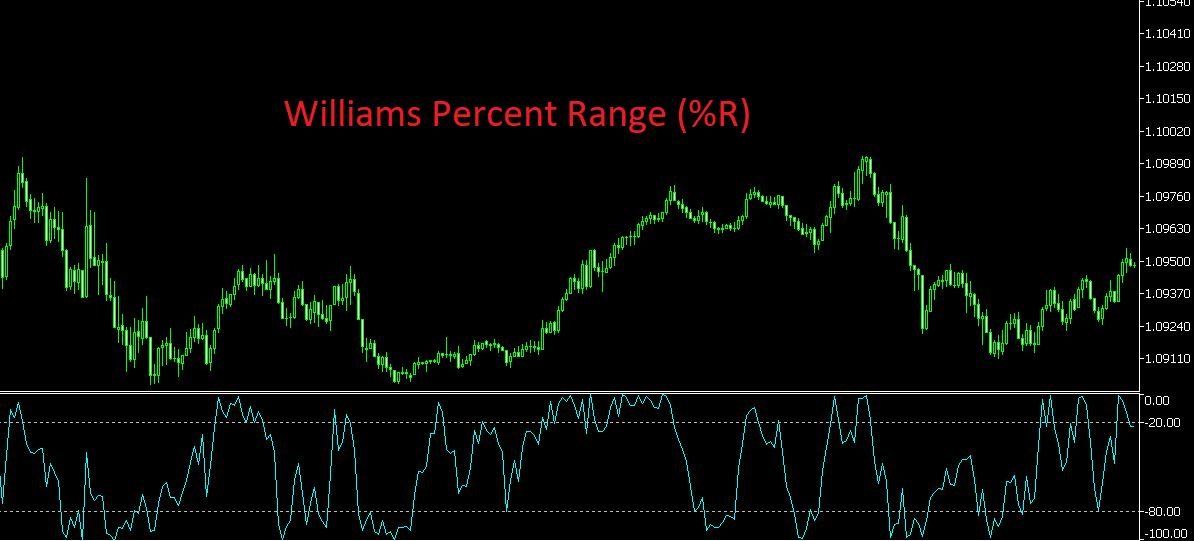
Visualization: Williams %R below the price chart with marked overbought (-20) and oversold (-80) levels
3. Interpreting Williams %R Values
3.1. Overbought and Oversold Levels
Classic threshold values for Williams %R:
- Above –20 (from –20 to 0) — overbought zone. The closing price is near the period's highs, indicating a possible downward correction.
- Below –80 (from –80 to –100) — oversold zone. The closing price is near the period's lows, indicating a possible upward bounce.
Important: as with the stochastic, in a strong trend the indicator can remain in overbought territory (during an uptrend) or oversold territory (during a downtrend) for an extended period. Therefore, signals based solely on entering the zone are considered premature. A more reliable approach is to wait for the indicator to exit the extreme zone.
3.2. Entry and Exit Signals
Traders often use the following logic:
- Buy signal: %R falls below –80 (oversold) and then rises back above –80. This suggests selling pressure has weakened and a rise is possible.
- Sell signal: %R rises above –20 (overbought) and then falls back below –20. This indicates weakening buying pressure and a likely decline.
For increased reliability, wait for the candle on which the exit from the zone occurs to close.
3.3. Extreme Values and "False" Breakouts
Sometimes price can suddenly move beyond the recent range, causing %R to "stick" at values of 0 or –100. This often happens during news events or strong impulses. In such cases, the indicator temporarily loses its informativeness, and it is better to wait for the market to stabilize.
4. Williams %R Divergences: Harbingers of Reversal
Like most oscillators, Williams %R is excellent for spotting divergences — discrepancies between the direction of price and the indicator's readings. Due to %R's high sensitivity, divergences on it often appear earlier than on RSI or MACD.
Bullish Divergence
Situation: Price makes a lower low, but %R forms a higher low (i.e., the %R value becomes less negative).
Meaning: Bearish momentum is weakening. An upward reversal or strong correction is expected.
Action: Prepare to buy; enter after confirmation (e.g., breakout of local resistance or %R exiting oversold zone).
Bearish Divergence
Situation: Price makes a higher high, but %R forms a lower high (the %R value becomes more negative).
Meaning: Bullish momentum is fading. A downward reversal or deep correction is expected.
Action: Prepare to sell; enter after confirmation (e.g., breakout of local support or %R exiting overbought zone).
The reliability of divergences on Williams %R increases when they form on higher timeframes (H4, D1) and are confirmed by other indicators such as MACD or CCI. Additionally, paying attention to volume is useful: increasing volume in the direction of the expected reversal strengthens the signal.
5. Practical Trading Strategies with Williams %R
5.1. "Exit from Zone" Strategy
This is the basic strategy described above: wait for %R to cross beyond the –80 or –20 level and then return.
- Buy: %R falls below –80, then rises above –80. Enter on the close of the signal candle. Stop‑loss beyond the nearest local low. Take‑profit at the nearest resistance level or 2–3 ATR.
- Sell: %R rises above –20, then falls below –20. Enter on the close of the signal candle. Stop‑loss beyond the nearest local high. Take‑profit at the nearest support level or 2–3 ATR.
5.2. Williams %R + Trend Filter (EMA 200)
To avoid trading against a strong trend, add a 200‑period exponential moving average (EMA 200):
- If price is above EMA 200 — uptrend. Ignore sell signals; consider only buys (%R exiting oversold zone or bullish divergences).
- If price is below EMA 200 — downtrend. Ignore buy signals; consider only sells (%R exiting overbought zone or bearish divergences).
5.3. Combining Williams %R with Support/Resistance Levels
The strongest Williams %R signals occur when an exit from the overbought/oversold zone coincides with price touching an important level. For example, if price tests strong support and %R exits the oversold zone at the same time, it provides a powerful buy signal. Similarly, when testing resistance and %R exits the overbought zone — a sell signal.
“Williams %R is like a radar that detects overheated and oversold market conditions. But remember: in a strong trend, the market can remain 'overheated' for a very long time.”
6. Pros and Cons of Williams %R
Pros
- Simplicity and clarity — one line and clear –20/–80 levels.
- High sensitivity — reacts quickly to price changes, ideal for scalping and day trading.
- Versatility — works on all markets and timeframes.
- Effective on divergences — provides early reversal signals.
Cons
- False signals in sideways markets — frequent level crossovers without follow‑through.
- Lag on higher periods — with a large period, signals arrive with delay.
- Does not show trend direction — requires combination with trend indicators.
Williams %R Under Algorithmic Watch
Due to its high sensitivity, Williams %R generates many signals, and manually tracking them across dozens of instruments is extremely tedious. The AemmTrader service automatically calculates %R on all timeframes, filters signals by trend and volume, and detects divergences in real time.
The platform analyzes %R behavior in the context of multi‑timeframe analysis (from M5 to D1) and confirms signals with a graphic pattern scanner. Dynamic stop‑loss and take‑profit levels are calculated based on current volatility (ATR). You receive not just a notification, but a ready‑made trade idea with risk assessment.
With AemmTrader, you stop staring at endless level crossovers and focus on decision‑making. This is the enhancement of your experience with the speed and accuracy of algorithms.