FRAMA Indicator: Complete Guide to Fractal Adaptive Moving Average
Fractal Adaptive Moving Average (FRAMA) is an indicator created by John Ehlers that dynamically adjusts the smoothing period based on market volatility, using the concept of fractal dimension. In this guide, we will break down the formula, trading strategies, and the advantages of FRAMA over regular moving averages.
1. What is Fractal Adaptive Moving Average (FRAMA)?
Fractal Adaptive Moving Average (FRAMA) is a technical indicator developed by John Ehlers in 1994. Unlike regular moving averages (SMA, EMA) that use a fixed period, FRAMA dynamically changes the smoothing length depending on the fractal dimension of the price series. This allows the indicator to be fast during trends and slow during consolidations.
The idea behind FRAMA is that markets exhibit fractal behavior — self‑similarity across different time scales. When the market moves directionally, the fractal dimension is low, and FRAMA shortens its effective period, following price more closely. In a sideways market, the dimension is high, and the indicator smooths out noise, becoming more inert.
Thanks to this adaptivity, FRAMA minimizes the lag inherent in traditional averages and provides more timely signals. It pairs well with oscillators like RSI or Stochastic, as well as with support/resistance levels.
"Markets are fractal by nature. FRAMA uses this feature to adapt to market conditions in ways that traditional indicators cannot."
2. FRAMA Calculation Formula
FRAMA is based on calculating the fractal dimension (D) of the price series, which is then converted into a smoothing coefficient α (alpha). The calculation occurs in several steps.
2.1. Computing the Fractal Dimension (D)
For a period N (usually 16 or 20), three values are calculated:
- N1 = (Highmax − Lowmin) over the first half of the period;
- N2 = (Highmax − Lowmin) over the second half of the period;
- N3 = (Highmax − Lowmin) over the entire period.
Then the fractal dimension D is calculated:
The value of D typically ranges from 1.0 to 2.0. Low D (closer to 1) indicates a strong trend, high D (closer to 2) indicates a sideways market.
2.2. Computing the Coefficient α (alpha)
The fractal dimension is converted into a smoothing coefficient α, which determines how fast FRAMA reacts to new prices:
When D ≈ 1 (strong trend), α ≈ 1, and FRAMA behaves like a fast EMA. When D ≈ 2 (sideways), α ≈ 0.01, and the indicator becomes very slow, filtering out noise.
2.3. Recursive Calculation of FRAMA
The FRAMA value on each bar is calculated using a formula similar to EMA, but with a dynamic weight α:
Thus, FRAMA automatically accelerates in a trend and slows down in a sideways market, providing an optimal balance between reaction speed and noise filtering.
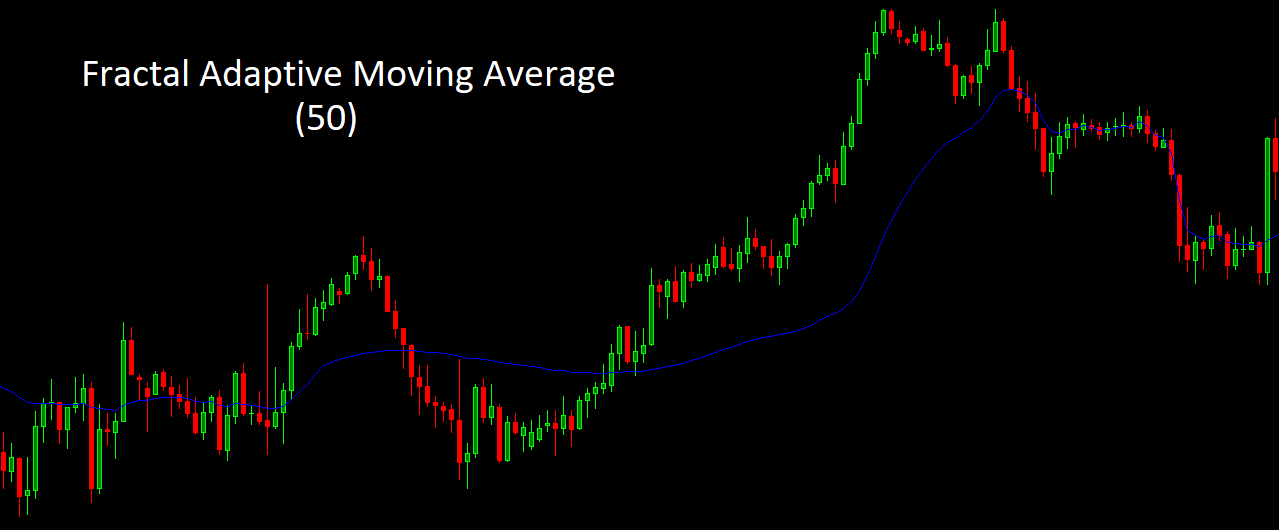
Visualization: FRAMA dynamically adjusts sensitivity to market conditions
3. Practical Trading Strategies with FRAMA
3.1. Price and FRAMA Crossovers
As with any moving average, the crossover of price and the FRAMA line generates signals:
- Bullish signal: price crosses above FRAMA — buy signal.
- Bearish signal: price crosses below FRAMA — sell signal.
Thanks to adaptivity, FRAMA signals in a trend appear earlier than those of SMA, and in sideways markets the number of false crossovers is lower than with a fast EMA.
3.2. FRAMA Slope Direction
The direction and angle of FRAMA indicate the current tendency:
- Upward slope — preference for long positions.
- Downward slope — preference for short positions.
- Horizontal movement — market in consolidation; it is better to refrain from trading.
3.3. FRAMA as Dynamic Support/Resistance
The FRAMA line often acts as a dynamic level from which price bounces. In an uptrend, one can buy on a pullback to FRAMA; in a downtrend, sell when price tests the line from above.
3.4. Combination with Oscillators
To filter signals, FRAMA works well with RSI or MACD. For example, a buy signal is considered strong if price crosses above FRAMA while RSI is in the oversold zone (below 30).
4. FRAMA vs. Other Moving Averages
To understand the advantages of FRAMA, let's compare it with popular alternatives:
| Indicator | Lag | Sensitivity | Adaptivity |
|---|---|---|---|
| SMA | High | Low | None |
| EMA | Medium | Medium | None |
| WMA | Medium | Above average | None |
| DEMA | Low | High | Partial |
| FRAMA | Minimal | Dynamic | Full (fractal) |
FRAMA wins due to its ability to automatically change sensitivity: in a trend it is faster than EMA, and in a sideways market it is smoother than SMA.
5. Pros and Cons of FRAMA
Pros
- Dynamic adaptation — automatically adjusts to volatility.
- Minimal lag — signals in a trend arrive earlier than with EMA.
- Noise filtering — becomes smooth in sideways markets, reducing false triggers.
- Versatility — works on all markets and timeframes.
Cons
- Complex calculation — manual calculation is practically impossible.
- False signals on low timeframes — due to high volatility.
- Ineffective in prolonged sideways markets — may give late signals when exiting consolidation.
Automated FRAMA Analysis with AemmTrader
Manually tracking FRAMA crossovers, slope changes, and combinations with oscillators across dozens of instruments requires time and discipline. The AemmTrader service is an intelligent platform for real‑time market analysis. We use neural network ensembles, automatic pattern recognition, and advanced technical analysis algorithms to give you a statistical edge.
Heart of the System: Neural Network Ensemble. We don't trust a single indicator. AEMMtrader's forecast is the result of consensus among dozens of independent mathematical models analyzing a window of the last 100 candles.
With AemmTrader, you only see those moments when the market is truly ready for a strong move. This saves time and increases your trading efficiency.