Profit Targets in Trading: Methods and Strategies
The ability to set a proper profit target is an art that separates the professional from the amateur. In this guide we will cover all major methods for determining target prices: from classic support/resistance levels to calculating targets for chart patterns (peaks, troughs, head and shoulders, triangles, flags) and Arthur Sklarew's Rule of Seven.
1. Episodic Models (Price Spikes)
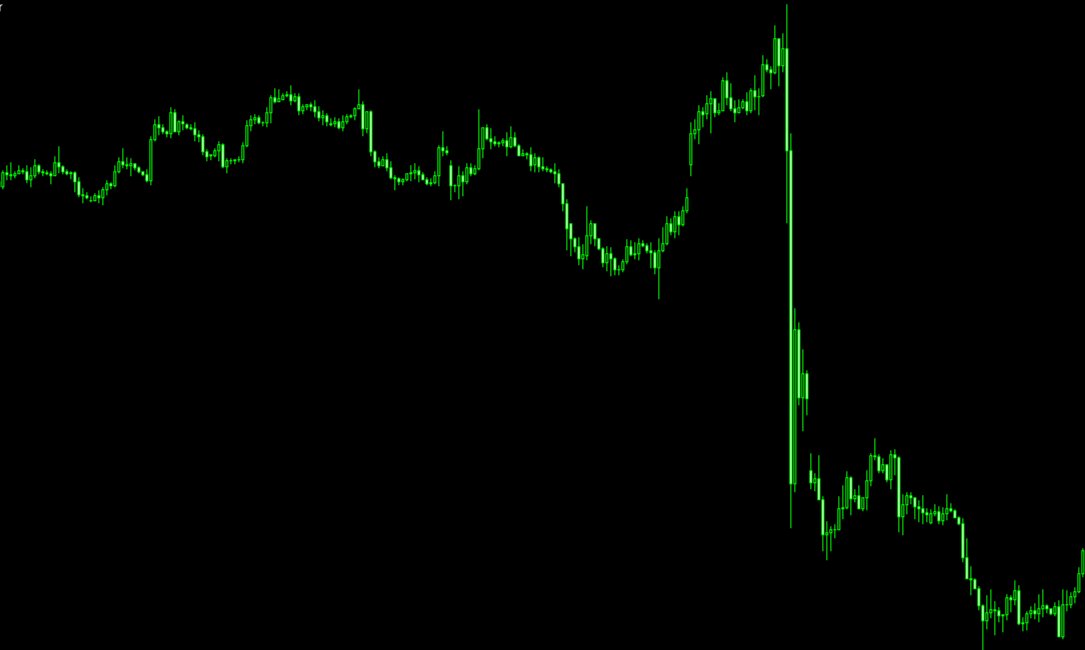
In response to sudden news, prices usually change sharply. The move from one important level to another is called an episodic model or price spike (price shock). Until the late 1990s there were few such spikes, but the most significant occurred after the September 11, 2001 attacks. Spikes can also be caused by unexpected election results, sharp Fed rate hikes, currency devaluations, natural disasters, political assassinations (geopolitical events). Even an ordinary earnings report can cause a mini‑shock if it deviates from the consensus forecast.
After a sharp price change, a stabilization period follows – volatility returns to normal. If the news was not erroneous (in case of error prices immediately return), the market moves into a new trading range near extreme highs or lows. Traders need time to digest the information, and many consider the risk of trading during this period too high. Main takeaway: price spikes cannot be predicted, so strategies relying on such events are unreliable. Backtesting can create a false impression of predictability because computer analysis finds a trend or pattern that “predicted” the spike, when in fact it was random.
«The market can remain irrational longer than you can remain solvent. But price shocks are moments when irrationality peaks, and they are almost always followed by a cooling period.»
2. Target Prices in Chart Analysis
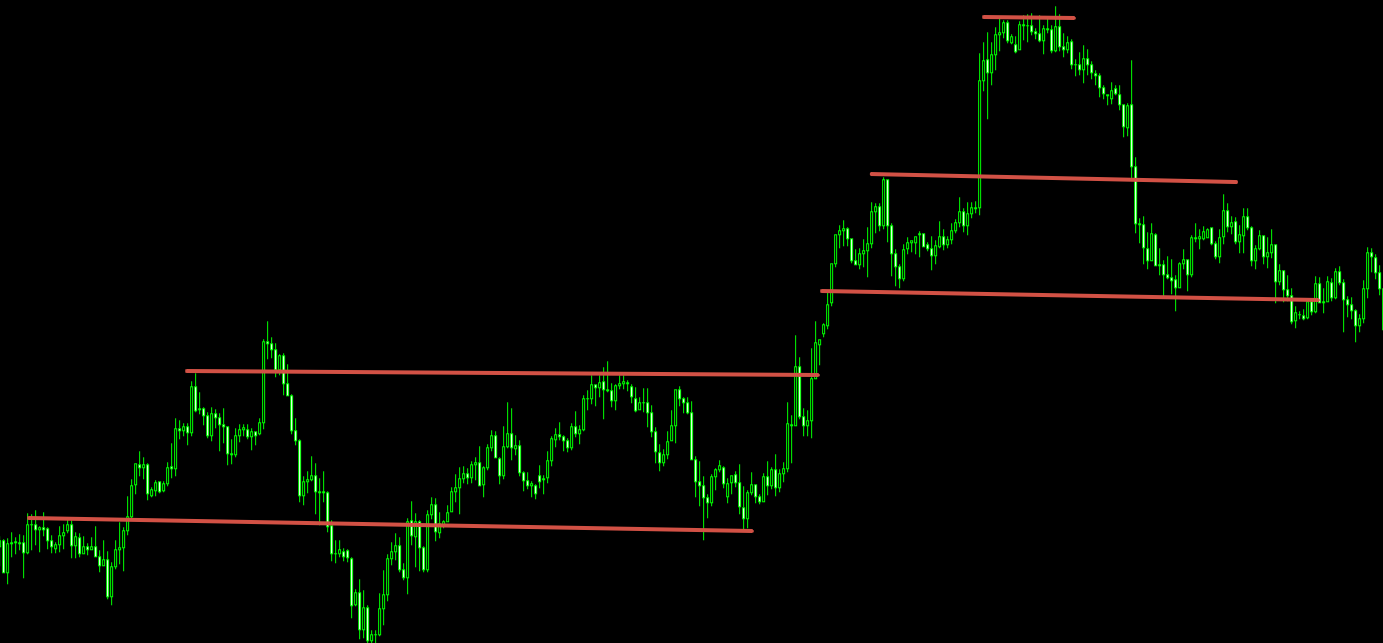
Most traders determine target levels to assess the risk/reward ratio. This is especially relevant for short‑term trading. The most logical and obvious reference is a significant support or resistance level previously identified on the chart. When opening a long position, look at the nearest resistance levels above the entry point. When these levels are tested, a correction or reversal often occurs. The stronger the level, the higher the probability of a price stop.
During a strong uptrend, volatility may cause a small breakout followed by a return to the previous range – this is considered a false breakout and confirmation of the old level. Placing a target directly below a significant resistance (for a long position) or just above a support (for a short position) is a conservative and safe practice.
Flexibility in target setting. Regardless of the method, be prepared to take profit earlier if the market changes. Monitor the current trend – sometimes a trend change is more important than reaching the calculated target. If the target is reached, look for a new pattern. If after closing the trade prices first fall and then break previous extremes, you can re‑enter the position with a new target.
3. Profit Targets for Consolidation Areas and Channels
The simplest model is a horizontal consolidation zone bounded by horizontal support and resistance lines. There are three main calculation methods:
- Classic method: the target is above the breakout level by a distance equal to the height of the consolidation zone (resistance minus support, added to resistance). The expected move equals the extreme volatility of the zone.
- Method for extended rectangular patterns: the target is calculated by adding the width of the consolidation zone to the support level (not resistance). This method is well‑known but not always realistic for highly stretched patterns.
- Conservative method: use the average volatility of the consolidation model or reduce the classic target by 20%. This helps avoid the influence of extreme outliers.
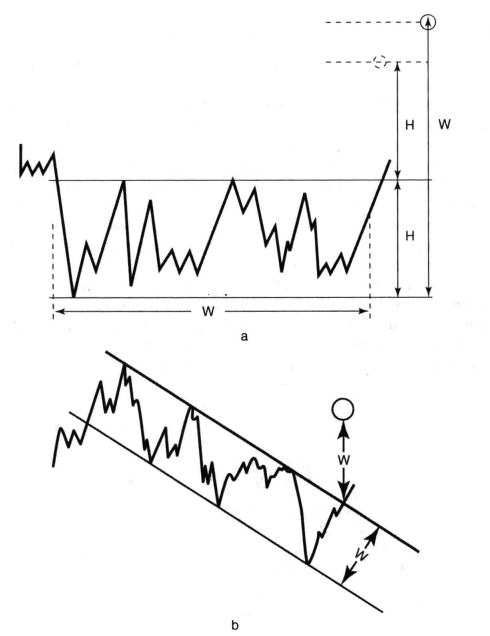
For a sloping channel, the target price is calculated similarly: measure the channel width perpendicular to the support and resistance lines, then project that width from the breakout point. The channel length does not affect the target, but in practice the target is often made slightly smaller than the channel itself.
4. Adjusting the Target Price Using Channels
As the market trend develops, target prices can be refined using new channels. In the figure below, an uptrend turned into a downtrend. After breaking the uptrend channel, we expect price to reach a low at point “a”, then bounce to point “b”. From the previous high “h” to the top “b” we can draw a resistance line “1R”, and through point “a” parallel to it a support line “1S”, forming a descending channel.
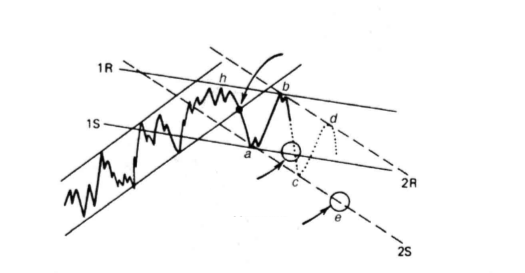
Target price “1” lies on line “1S”. It is not very accurate because it is determined at an early stage. If price reaches “a” and then rises to “d”, a more justified channel “2R” – “2S” can be built, and the support line again becomes the place for a new target. As new highs and lows appear, refine the upper and lower trend lines. The primary line is always drawn first, then a new target is chosen on the parallel trend line.
5. Setting Profit Targets After Peaks and Troughs
5.1. Target for a Peak (V‑shaped, Double, Triple)
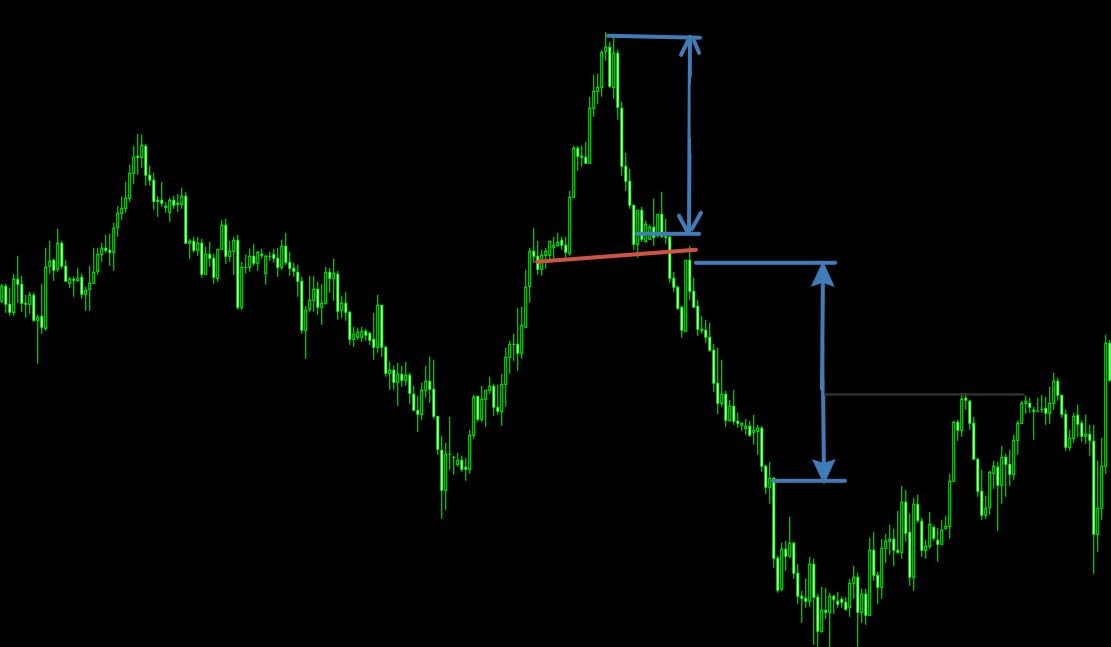
To determine the target, measure the height of the “peak” pattern (distance from the peak high to the confirmation level – e.g., neckline or support breakout). Project that height downward from the breakout point. This method applies to any type of peak.
5.2. Target for a Trough
Similarly, measure the distance from the lowest price of the trough to the confirmation point (resistance breakout) and project it upward from the breakout level. This method is universal for any type of trough.
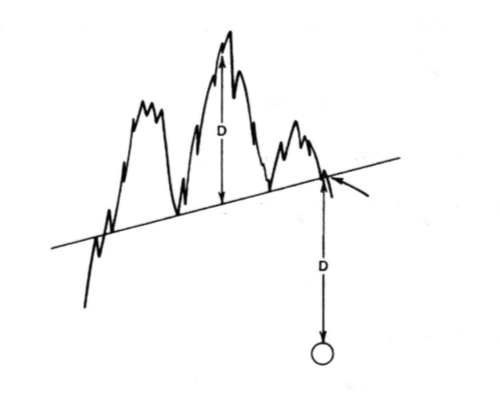
5.3. Target for the Head and Shoulders Pattern
Measure the vertical distance from the head top to the neckline. Project that distance from the point where the right shoulder breaks the neckline. For a large peak, this target may seem modest, but it serves as a good reference for the initial reaction and is safe even if a new high is reached later.
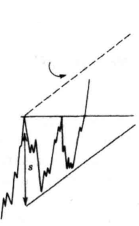
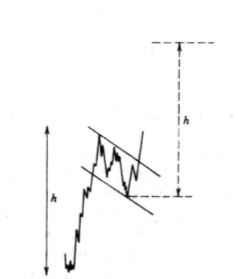
5.4. Targets for Triangles and Flags
The triangle target equals the size of the initial move that formed the widest side of the triangle. The triangle can be viewed as a forming channel where the rising side forms the initial trend line. The target is calculated similarly to channels. For a flag, the target of the new breakout should equal the size of the move before the flag (the flagpole). However, applying this method to subsequent flags in a bull move may produce unrealistically distant targets.
6. Arthur Sklarew's Rule of Seven
Arthur Sklarew developed a method for determining target prices based on the volatility of the previous consolidation period. The rule involves calculating three successive targets in a specific ratio. Important: the rule is not symmetrical for uptrends and downtrends. Sklarew believed that reactions in a downtrend are closer together than in a rising market because a major bear market's decline is limited, while bull markets can grow indefinitely.
How to calculate targets: measure the length L of the first price move (from the previous high or low, i.e., the most distant point before the first pullback).
📈 In an uptrend
Target 1 (T₁) = L × (7/4) = L × 1.75
Target 2 (T₂) = L × (7/3) ≈ L × 2.333
Target 3 (T₃) = L × (7/2) = L × 3.5
Where L is the length of the first upward move.
📉 In a downtrend
Target 1 (T₁) = L × (7/5) = L × 1.4
Target 2 (T₂) = L × (7/4) = L × 1.75
Target 3 (T₃) = L × (7/3) ≈ L × 2.333
Where L is the length of the first downward move.
The three targets are best used in the context of strong moves. In weak oscillations the first two targets may not be reached, but as Sklarew's practice shows, even if one target is missed, the others remain relevant. The Rule of Seven is especially useful for position traders working on medium‑ and long‑term trends.
«The Rule of Seven is not magic but a reflection of market psychology: in a bull market targets expand, in a bear market they contract. Understanding this allows you to set more realistic targets.»
Practical Tips for Setting Profit Targets
- Always assess the risk/reward ratio. Do not enter a trade if the potential profit is less than the potential loss by at least a factor of 2.
- Use multiple methods simultaneously. Compare the target from levels, consolidation volatility, and the Rule of Seven – if they converge, the signal is stronger.
- Consider the time horizon. For short‑term trades use closer targets (e.g., classic target reduced by 20%). For long‑term trades use the full pattern height.
- Monitor volume. As price approaches the target, volume should confirm the strength of the move. If volume drops, a reversal risk is high.
- Do not be afraid to take partial profits. Close part of the position at the first target, the rest at the second or third. This reduces psychological pressure.
How Technology Helps Determine Profit Targets
Manual calculation of targets for dozens of chart patterns is time‑consuming and error‑prone. Modern services like AemmTrader automatically determine target prices after pattern identification. The system recognises triangles, flags, pennants, head and shoulders, double/triple tops and bottoms, and then instantly calculates classic targets (by pattern height) and conservative targets (adjusted for volatility).
The neural network also takes into account the Rule of Seven and dynamic support/resistance levels, giving you ready‑made stop‑loss and take‑profit levels. This allows you to focus on decision‑making rather than calculations. You simply see three targets (minimum, probable, maximum) on the chart and choose the one that fits your trading style.
Using such tools, you can backtest strategies, evaluate target achievement rates, and increase the efficiency of your trades. This is the bridge between amateur and professional approaches – saving time and increasing profit.