Moving Averages in Trading: Types, Signals and Practical Application
The moving average (MA) is one of the oldest yet indispensable technical analysis indicators. It helps smooth out price noise, reveal the true trend direction, find entry points, and take profits in time. In this guide, we will cover all types of moving averages, their signals, and how to filter false triggers.
1. What is a Moving Average (MA)
A moving average (English: Moving Average, MA) is a technical indicator that averages an asset’s price over a specific period, constantly “moving” along the chart. The main goal of MA is to smooth out random price fluctuations (market noise) and make the trend more visible.
Imagine looking at a chaotic EUR/USD chart with erratic peaks and falls. By applying a 50-period moving average, you will see a clear line that reflects the overall direction, ignoring short‑term spikes. It is this ability that makes MA loved by both novice and professional traders.
1.1. Formula and working principle
The simplest form is the Simple Moving Average (SMA). It is calculated as the arithmetic mean of closing prices over a chosen number of periods. For example, for a 10‑day SMA:

where pt is the closing price of the current period, and pt‑i are closing prices of previous periods. Each new day, the oldest element drops out and the newest one is added – hence the name “moving”.
The longer the period, the smoother the line and the slower it reacts to price changes. Short periods (e.g., 10–20) suit scalping and short‑term trading, while long periods (50, 100, 200) are used to identify the global trend.
1.2. Types of moving averages
Besides simple SMA, there are other types, each with its own characteristics:
Simple (SMA)
Equal weights for all prices. Strong smoothing but can lag. Ideal for long‑term trends.
Exponential (EMA)
Gives more weight to recent prices. Reacts faster, popular among short‑term traders.
Weighted (WMA)
Also gives more weight to recent data, but linearly. A compromise between SMA and EMA.
Smoothed (SMMA)
Considers all available data with gradually decreasing weights. Used less often but gives a very clean signal.
In practice, most traders choose between SMA (for long‑term strategies) and EMA (for short‑ and medium‑term). In trading platforms (MetaTrader, TradingView, AEMMtrader) you can easily find all these varieties.
2. Signals given by moving averages
Moving averages provide many trading signals. Let’s look at the most important ones.
2.1. Determining trend direction
The simplest way: if price is above the MA and the MA is pointing up – the trend is upward (bullish). If price is below the MA and the MA is pointing down – the trend is downward (bearish).
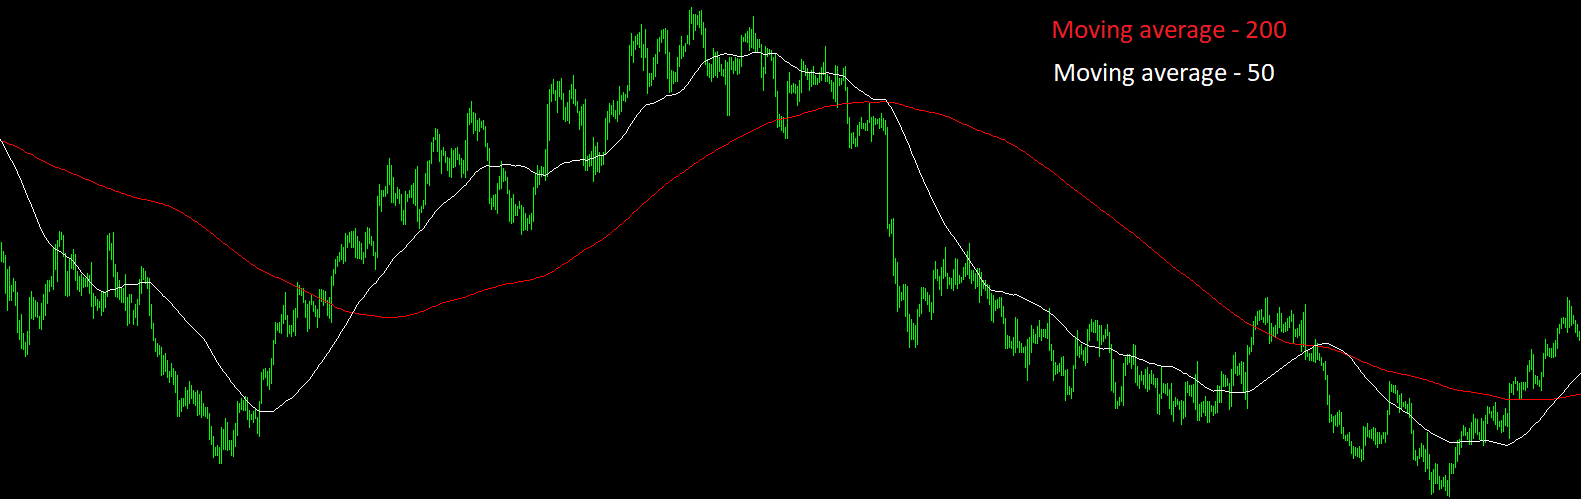
As seen on the chart, the short MA reacts faster to reversals, while the long MA serves as a filter for the main trend. Many traders use a combination of two MAs, e.g., 50 and 200 periods.
2.2. Dynamic support and resistance levels
In a strong trend, the moving average often acts as a “live” level: in an uptrend, price bounces up from the MA (support); in a downtrend, it meets resistance from below.
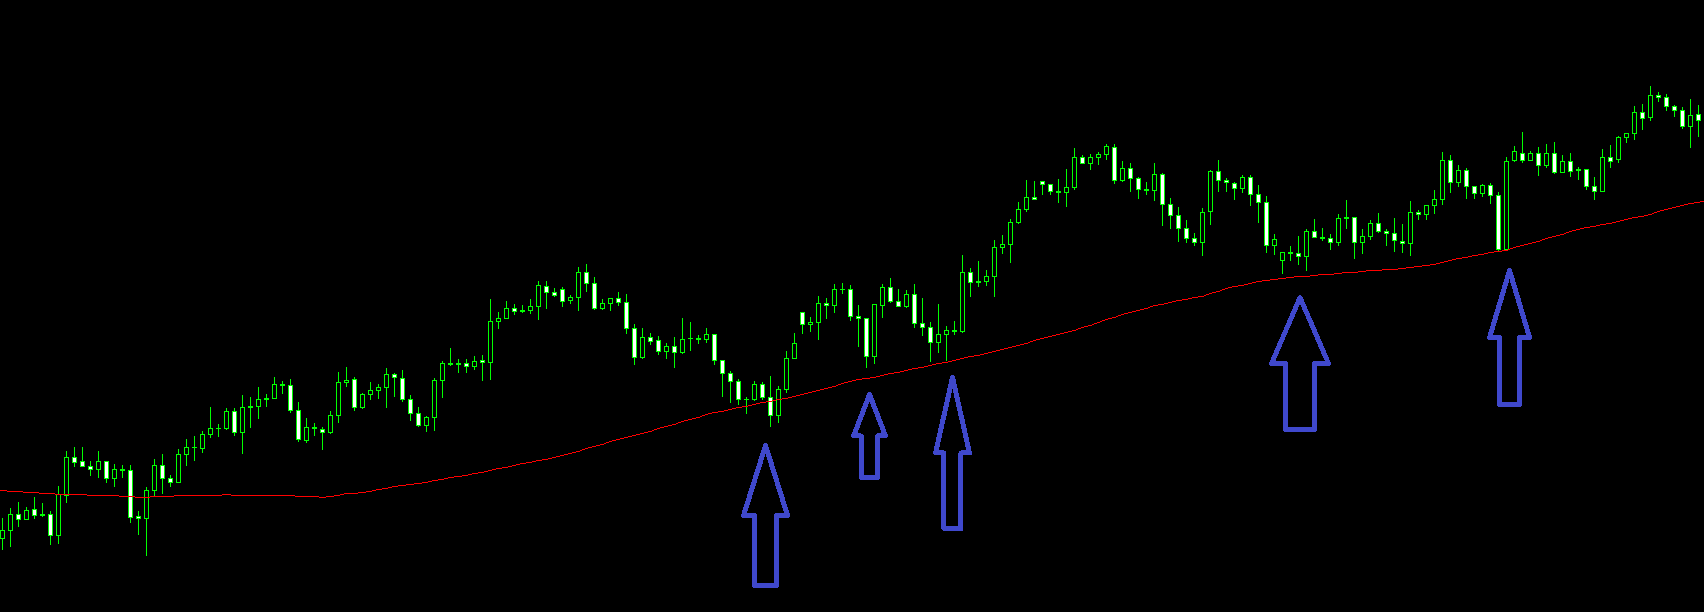
Traders actively use this property to set stop‑losses: place a protective order slightly below the MA (for long positions) or above it (for short positions). When price breaks the MA, the trend weakens – a signal to exit.
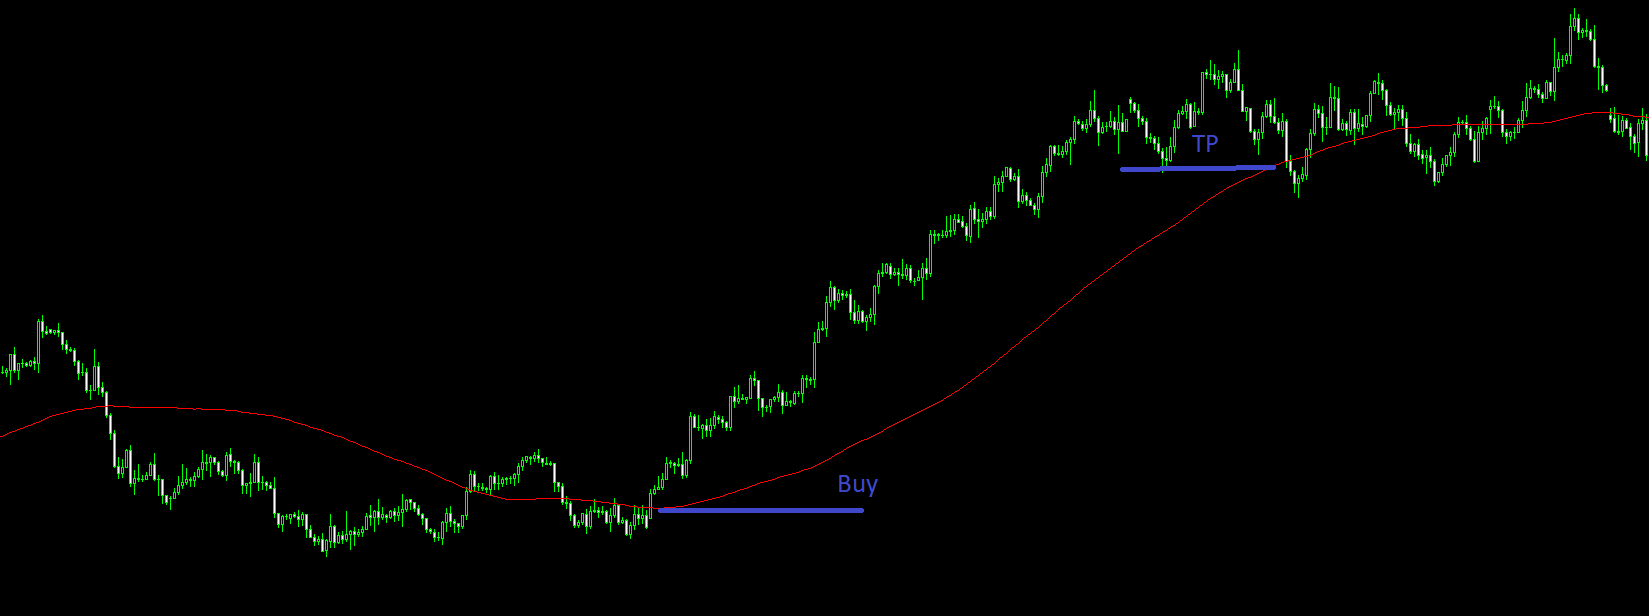
2.3. Setting stop‑loss and take‑profit levels
Moving averages help not only to enter but also to exit trades. For example, in an uptrend you can hold a position as long as price stays above the MA. Once price closes below the MA – it’s a signal to lock in profits or move the stop.
«Don’t try to catch the bottom or the top. Let the moving average tell you when to join the trend.»
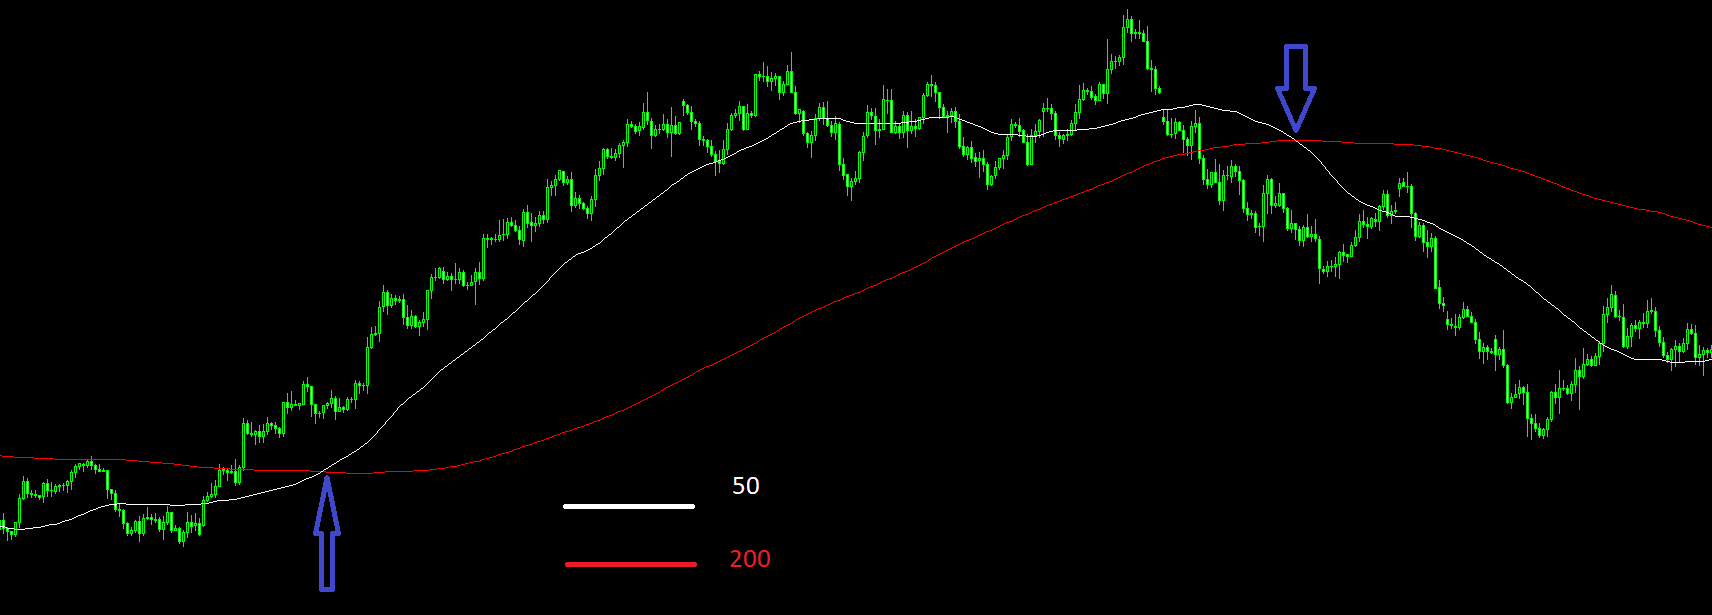
2.4. Moving average crossover (Golden Cross and Death Cross)
One of the most famous signals is the crossover of two moving averages with different periods. The classic pair: 50‑period and 200‑period MA.
- “Golden Cross” – the short MA crosses the long MA from below. Considered a strong bullish signal, often foreshadowing long‑term growth.
- “Death Cross” – the short MA crosses the long MA from above. A sell signal and possible start of a bear market.
The larger the MA periods, the more reliable the signal – but the later it comes. For intraday trading, pairs (5,10), (10,20) or (20,50) are often used.
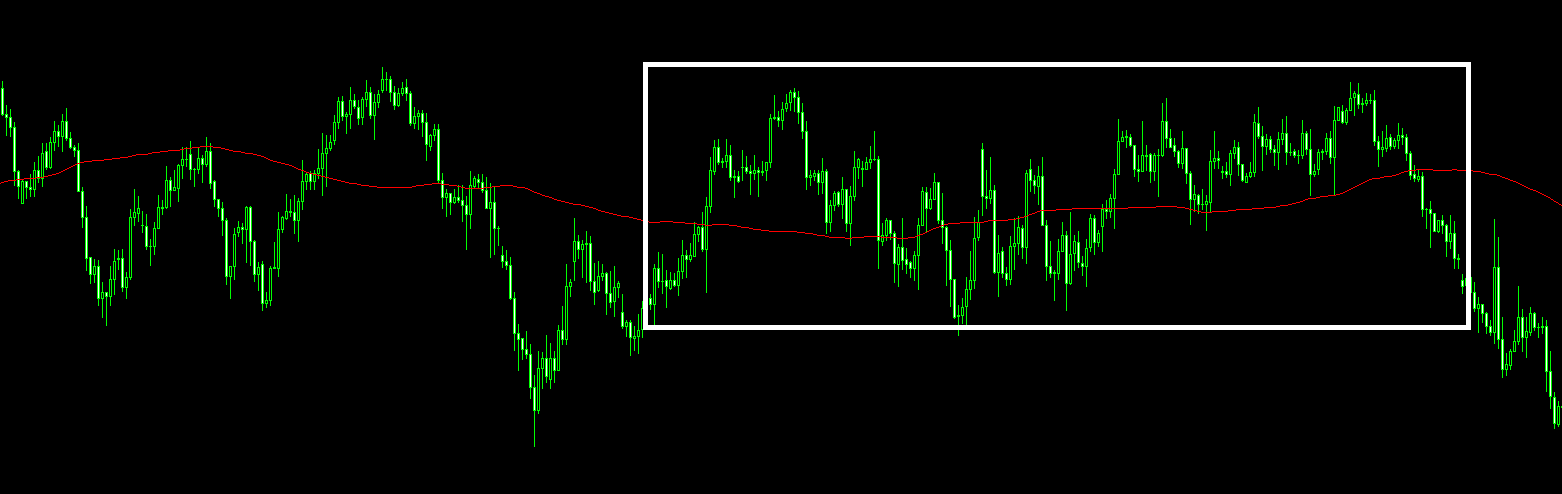
2.5. False signals of moving averages
The main drawback of MA is that they lag and give false signals during flat (sideways) markets. The chart below shows how MA crossovers lead to losing trades during consolidation.
To filter out false signals, experienced traders combine MA with other indicators: RSI, Stochastic or Bollinger Bands. For example, enter on MA crossover only when RSI is not in overbought/oversold territory.
3. Practical tips for using moving averages
- Choose the period according to your trading style: scalpers – MA 5–20, day traders – 20–50, swing traders – 50–100, long‑term investors – 100–200.
- Use multiple MAs simultaneously. A combination of fast and slow MA gives more reliable signals than a single line.
- Filter out flat markets. Add the ADX indicator (Average Directional Index). When ADX is below 20–25 – the market is flat, ignore MA signals.
- Backtest on historical data. Before applying MA in real trading, test its effectiveness on your asset’s history.
- Don’t forget multi‑timeframe analysis. A signal on a lower timeframe should align with the direction of the higher‑timeframe trend (e.g., H1 and D1).
If you want to automate this process, check out AEMMtrader – our platform uses an ensemble of neural networks, Monte Carlo simulations, and adaptive risk management to filter false signals and improve forecast accuracy.
Advice from a professional
«Moving averages are like a compass. They don’t tell you where to go, but they show where you are relative to the trend. Learn to read them, and the market will cease to be chaos.»