VIDYA Indicator: Complete Guide to Variable Index Dynamic Average
Variable Index Dynamic Average (VIDYA) is an adaptive moving average developed by Tamas Varga that dynamically adjusts its smoothing period based on market volatility. In this guide, we will break down the formula, settings, signals, and practical trading strategies with VIDYA.
1. What is Variable Index Dynamic Average (VIDYA)?
Variable Index Dynamic Average (VIDYA) is an adaptive moving average created by American financier Tamas Varga in the 1990s. Unlike classic SMA and EMA, which use a fixed period, VIDYA automatically adjusts its smoothing coefficient based on current market volatility. This allows the indicator to be fast and responsive during trends and smoother during consolidations.
The core idea behind VIDYA is that market volatility (measured by standard deviation) should influence the reaction speed of the moving average. When volatility is high, VIDYA becomes more responsive to keep up with rapid price movements; when the market quiets down, the indicator slows down, filtering out noise and false signals.
VIDYA pairs well with oscillators such as RSI or Stochastic, as well as with support and resistance levels, helping traders obtain more accurate entry and exit signals.
"VIDYA is an attempt to create a truly intelligent moving average — one that not only follows price but understands when to speed up and when to slow down."
2. VIDYA Calculation Formula
VIDYA is calculated recursively, similarly to an exponential moving average (EMA), but with a dynamic weight α that depends on current volatility.
2.1. Core VIDYA Formula
where αt is a dynamic smoothing coefficient that changes with each new bar.
2.2. Computing the Adaptivity Coefficient α
The coefficient α is computed based on the ratio of current volatility to some baseline level:
where:
- d — sensitivity constant (usually 0.2 or 0.6), setting the overall reaction speed;
- σt — current standard deviation of price over a chosen period (e.g., 9 or 20);
- σbase — baseline standard deviation, which can be a long‑term average or a fixed value.
In practice, a simplified version is often used: αt = 2 / (n + 1) × (σt / σavg), where n is the base period and σavg is the average volatility over that period. In any case, when volatility rises, α increases and VIDYA reacts faster to new prices; when volatility falls, α decreases and the indicator smooths out noise.
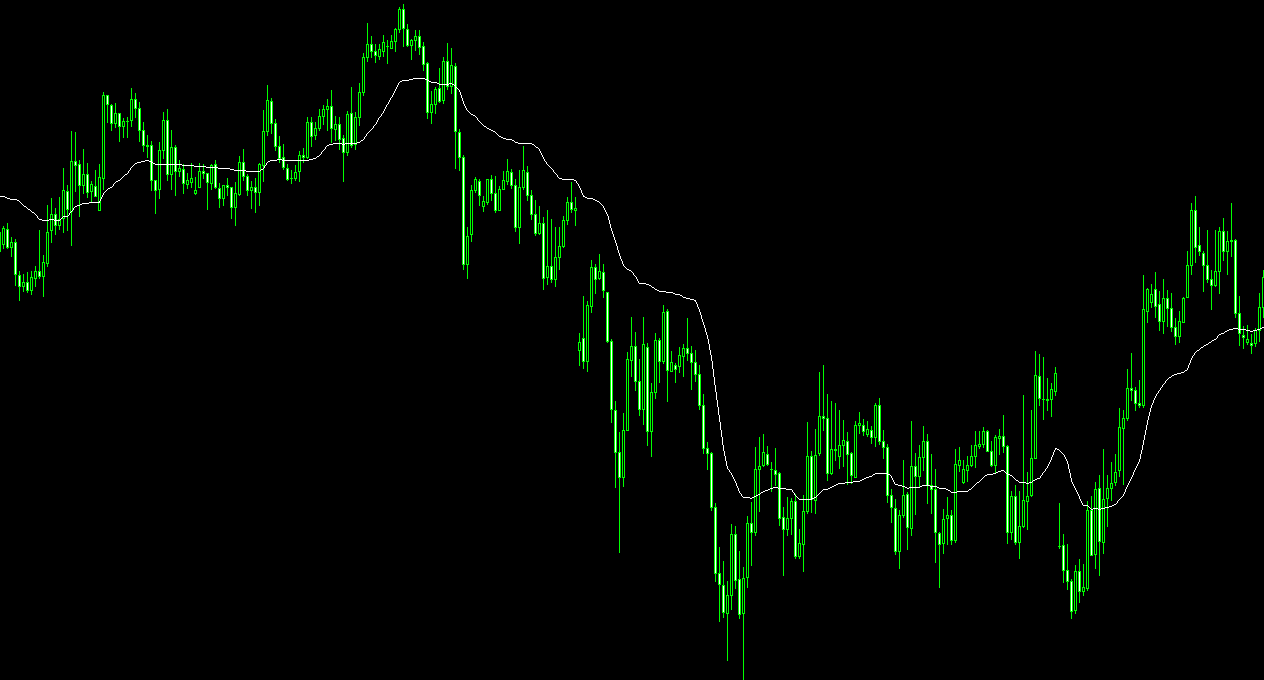
Visualization: VIDYA dynamically adjusts sensitivity to market volatility
3. VIDYA Signals and Trading Strategies
3.1. Price and VIDYA Crossovers
Like any moving average, VIDYA generates signals when price crosses the indicator line:
- Bullish signal: price crosses above VIDYA — buy signal.
- Bearish signal: price crosses below VIDYA — sell signal.
Thanks to its adaptivity, VIDYA signals in a trend appear earlier than those of SMA or EMA, and during sideways markets the number of false crossovers is reduced.
3.2. VIDYA Slope Direction
The angle of the VIDYA line indicates the strength and direction of the current trend:
- Upward slope — uptrend, preference for long positions.
- Downward slope — downtrend, preference for short positions.
- Horizontal movement — market in consolidation, better to refrain from trading.
3.3. VIDYA as Dynamic Support/Resistance
The VIDYA line often acts as a dynamic level from which price bounces. In an uptrend, one can buy on a pullback to VIDYA; in a downtrend, sell when price tests the line from above.
3.4. Combination with Oscillators
To filter signals, VIDYA works well with RSI or MACD. For example, a buy signal is considered strong if price crosses above VIDYA while RSI is in the oversold zone (below 30) or exiting it.
4. VIDYA Parameter Settings
Main parameters affecting VIDYA behavior:
- Volatility period (n): standard values are 9 or 20. A smaller period makes VIDYA more sensitive to short‑term volatility changes.
- Sensitivity constant (d): typically 0.2 for long‑term trends or 0.6 for active trading. Higher d means VIDYA reacts faster to volatility changes.
It is recommended to start with n=20 and d=0.5, then optimize them for a specific instrument and timeframe using historical testing.
5. Pros and Limitations of VIDYA
Pros
- Adaptation to volatility — automatically adjusts to market conditions.
- Reduced lag — responds to trends faster than classic MAs.
- Noise filtering — slows down during low‑volatility periods.
- Versatility — works on all markets and timeframes.
Limitations
- Complex setup — requires parameter tuning for each specific asset.
- False signals on sharp reversals — like any MA, VIDYA may lag at turning points.
- Ineffective in prolonged sideways markets — as with most trend indicators.
Automated Adaptive Analysis with AemmTrader
Manually tuning and tracking VIDYA signals across many instruments requires time and discipline. The AemmTrader service is an intelligent platform for real‑time market analysis. We use neural network ensembles, automatic pattern recognition, and advanced technical analysis algorithms to give you a statistical edge.
Heart of the System: Neural Network Ensemble. We don't trust a single indicator. AEMMtrader's forecast is the result of consensus among dozens of independent mathematical models analyzing a window of the last 100 candles. VIDYA is used in combination with other indicators to confirm trends and filter false signals.
With AemmTrader, you see only those moments when the market is truly ready for a strong move. This saves time and increases your trading efficiency.