Bollinger Bands: Complete Guide to Bollinger Bands
Bollinger Bands is an indicator created by John Bollinger in the 1980s that combines a moving average and standard deviations to assess volatility and identify extreme price levels. In this guide, we will break down the formula, settings, trading strategies, and combining with other indicators.
1. What are Bollinger Bands?
Bollinger Bands is a technical indicator developed by John Bollinger in the mid‑1980s. It consists of three lines: a central moving average (usually a 20‑period SMA) and two bands placed at a specified number of standard deviations (usually 2) away from it. The indicator visualizes market volatility: the bands widen when volatility increases and narrow when it decreases.
Unlike ordinary channel indicators, Bollinger Bands dynamically adapt to market conditions. They do not show trend direction but highlight areas where price is likely to encounter support or resistance. It is generally accepted that about 95% of price action occurs within the bands under standard settings.
Bollinger Bands pair well with oscillators (RSI, Stochastic) and trend indicators (MACD, moving averages). This makes them a versatile tool for filtering signals and assessing movement strength.
"Bollinger Bands are not a trading system but an analytical tool. They answer the questions 'is price high?' and 'is price low?' but do not tell you when to buy or sell."
2. Calculation Formula and Structure of Bollinger Bands
The indicator is based on a simple moving average (SMA) and the standard deviation of price.
2.1. Middle Band
The middle band is a simple moving average of the closing price over a chosen period (default 20):
2.2. Upper and Lower Bands
The upper and lower bands are calculated by adding and subtracting k standard deviations (σ) from the middle band:
Lower Band = Middle Band − k × σ
where σ is the standard deviation of price over the same period n, and k is a multiplier (usually 2). Under normal price distribution, about 95% of values should fall within ±2σ of the mean.
2.3. Standard Settings
- Period (n): 20 (for daily charts).
- Multiplier (k): 2.
These parameters can be adapted for specific instruments and timeframes. For intraday trading, periods of 10 or 14 are often used; for long‑term investing, 50 is common.
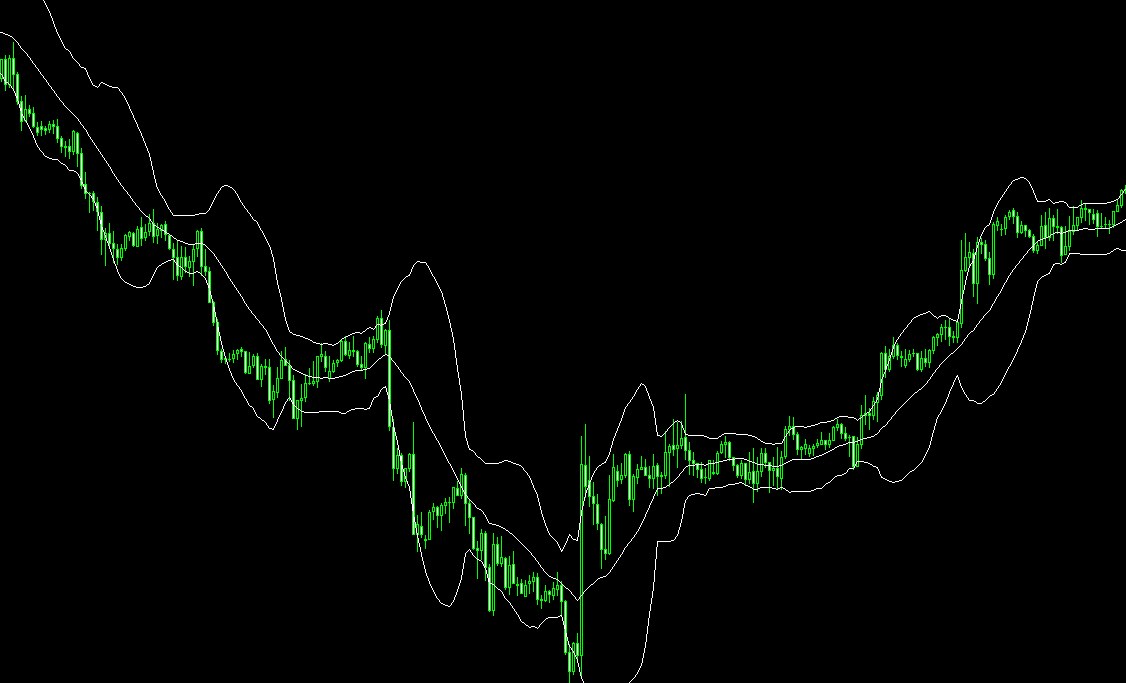
Visualization: Bollinger Bands contract during low volatility and expand during high volatility
3. Interpreting Bollinger Bands Signals
3.1. Overbought and Oversold
Although Bollinger Bands are not a classical oscillator, price touching or moving outside the upper band is often interpreted as overbought, and outside the lower band as oversold. However, in a strong trend, price can "ride" the band, and such touches are not reversal signals. Therefore, it is important to consider trend direction.
3.2. The Squeeze (Band Contraction and Expansion)
When the bands narrow to a minimum distance, it indicates low volatility and often precedes a strong price move. The "Bollinger Squeeze" strategy involves entering the market on a breakout of the level formed during the squeeze.
3.3. Walking the Bands
In a sustained uptrend, price often moves along the upper band, periodically touching or even exceeding it. This is a sign of trend strength. Similarly, in a downtrend, price hugs the lower band.
3.4. Reversal Patterns
On Bollinger Bands, one can observe candlestick reversal patterns (pin bars, engulfing). For example, a hammer forming at the lower band strengthens a bullish signal.
4. Practical Trading Strategies with Bollinger Bands
4.1. Mean Reversion
Classic strategy: when price touches the lower band, open a buy position targeting the middle line (or upper band). When price touches the upper band, open a sell position targeting the middle line. This strategy works best in sideways trends. In strong trends, filters should be used.
4.2. Band Breakout
If price decisively breaks above the upper band and closes above it, this may be a signal for continuation of an uptrend. Enter on the open of the next candle, place a stop‑loss beyond the middle line. Reverse logic for a downside breakout of the lower band.
4.3. W‑Bottoms and M‑Tops
John Bollinger described specific patterns: if price forms a first low below the lower band and a second low inside the bands or near the middle line, this is a W‑bottom signal (buy). Similarly, an M‑top is a sell signal.
4.4. Combination with RSI
A buy signal is considered strong if price touches the lower band and RSI is below 30 (oversold). Similarly for a sell signal: price touches the upper band and RSI is above 70.
5. Bollinger Bands Parameter Settings
Although standard settings (20,2) are universal, adapting to a specific market can improve results.
5.1. Choosing the Period
- Short‑term trading (M5‑M30): period 10‑14, multiplier 2.
- Medium‑term (H1‑H4): period 20, multiplier 2.
- Long‑term (D1 and higher): period 50, multiplier 2.5.
5.2. Standard Deviation Multiplier
- Increasing k to 2.5‑3 widens the channel, reducing false breakouts but delaying signals.
- Decreasing k to 1.5‑1.8 narrows the channel, making the indicator more sensitive.
6. Pros and Cons of Bollinger Bands
Pros
- Clear volatility visualization — easy to assess market activity.
- Versatility — works on all markets and timeframes.
- Flexible signals — suitable for both trend‑following and counter‑trend trading.
- Good compatibility — an excellent filter for other indicators.
Cons
- Lag — based on a moving average, signals arrive with delay.
- False breakouts — in a strong trend, price can walk the band for extended periods.
- Subjective settings — requires testing for each specific instrument.
Automated Bollinger Bands Analysis with AemmTrader
Manually tracking band squeezes, breakouts, and mean reversions across dozens of instruments is labor‑intensive. The AemmTrader service is an intelligent platform for real‑time market analysis. We use neural network ensembles, automatic pattern recognition, and advanced technical analysis algorithms to give you a statistical edge.
Heart of the System: Neural Network Ensemble. We don't trust a single indicator. AEMMtrader's forecast is the result of consensus among dozens of independent mathematical models analyzing a window of the last 100 candles.
With AemmTrader, you only see those moments when the market is truly ready for a strong move. This saves time and increases your trading efficiency.