Trend Lines in Trading: Types, Construction and Thomas DeMark's Method
A trend line is the simplest yet most powerful tool of graphic analysis. It defines the direction of price movement and often signals a trend reversal. In this article we will cover all types of trends, learn how to draw trend lines correctly, and explore Thomas DeMark’s unique approach that removes subjectivity from trend‑line construction.
1. Trends by direction
A trend line defines the current direction of price movement and often identifies the point where that direction changes. The trend line is the most popular and recognised tool of technical analysis. Analysts often say that “the trend is your friend”, meaning it is always safer to open a position in the direction of the trend.
In modern trading, three main types of trends are distinguished by direction:
1.1. Uptrend (bullish trend)
One standard definition of an uptrend is a sequence of higher highs and higher lows. An uptrend can be considered intact until the previous relative low is broken. Violation of this condition serves as a warning that the trend may have ended. Trends are often highlighted on charts by straight lines — trend lines drawn through successive lows (for an uptrend).
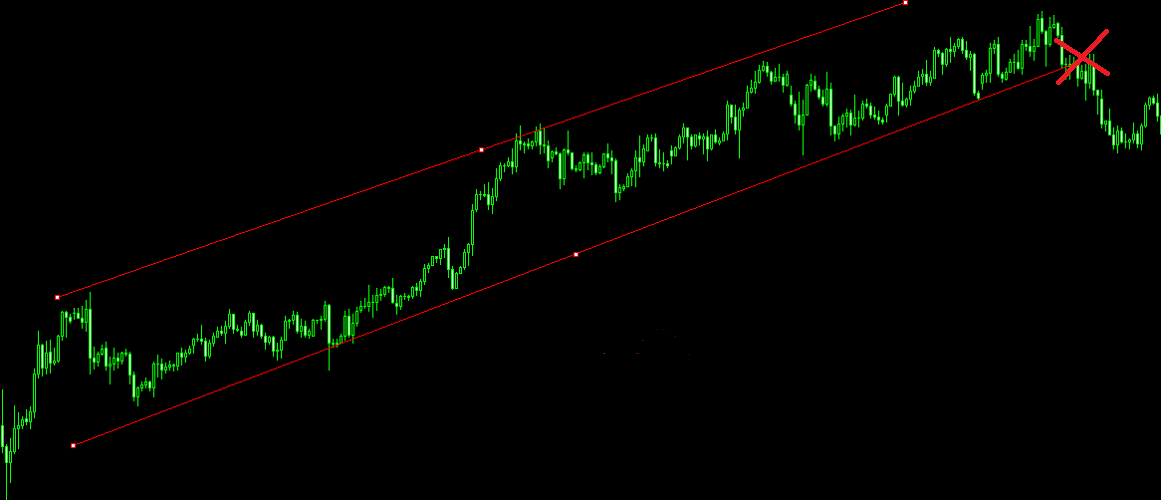
It should be noted, however, that a break in the sequence of higher highs and higher lows should be regarded only as one possible sign, not as an indisputable indicator of a trend reversal. False breakouts and temporary corrections are common. An experienced trader always waits for confirmation, for example a candle close below a key level.
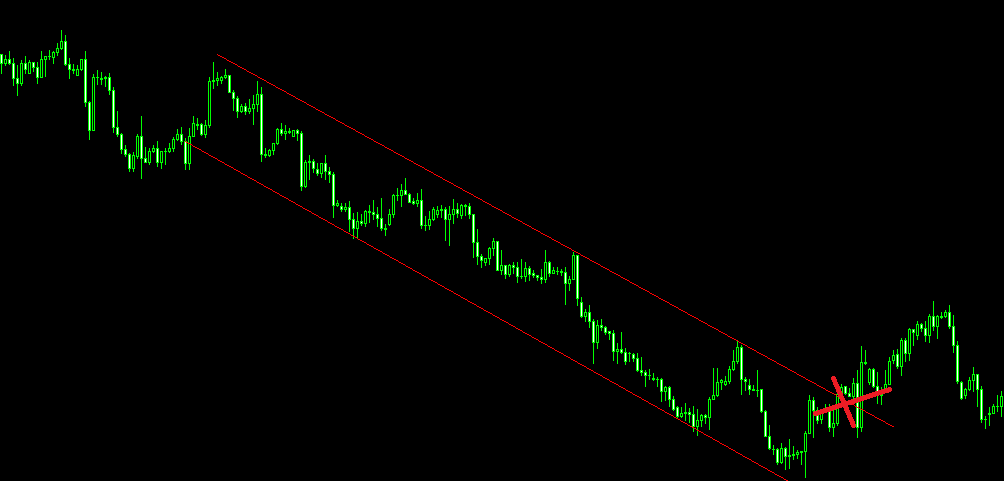
1.2. Downtrend (bearish trend)
The absolute opposite of an uptrend is a downtrend (bearish trend). A downtrend can be defined as a sequence of lower lows and lower highs. A bearish trend exists until the previous relative high is broken. In a downtrend, trend lines are drawn through successive highs.
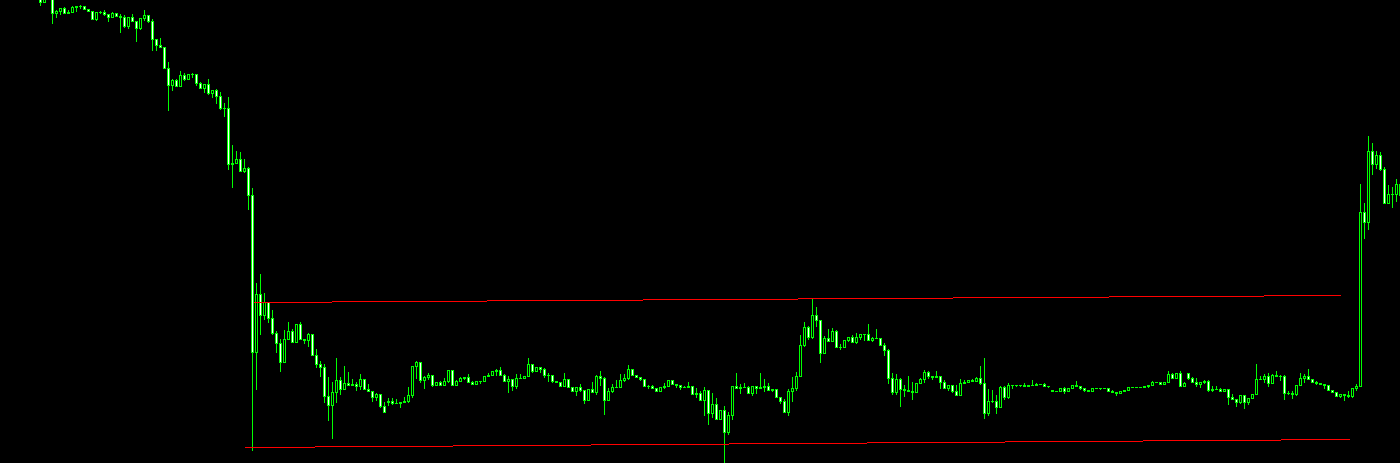
1.3. Flat (sideways trend)
If the market lacks any pronounced direction, such movement is called a flat (or sideways market). Highs and lows do not change significantly over a certain period, and all trading occurs inside a horizontal channel. Many traders say that trading in a flat is more predictable: support and resistance lines are clearly visible on the charts, and the level of risk is easy to determine. For flat trading, oscillators (e.g., RSI or Stochastic) work well.
2. Trends by time
Trends exist everywhere and last for a certain amount of time. By duration, trends are divided into three categories:
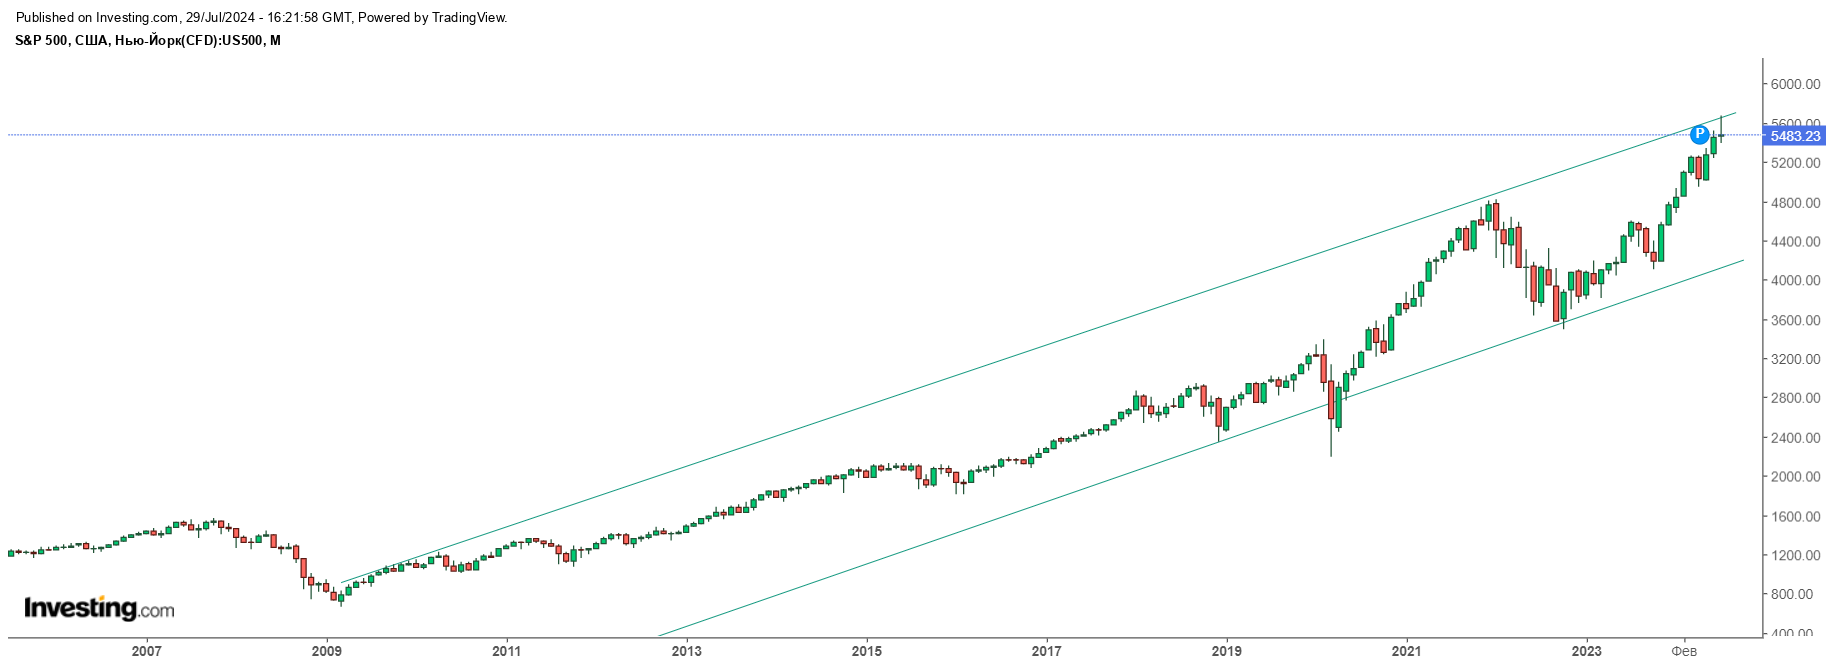
Long‑term trends
They develop over years and show the general trend of economies. Weekly and monthly charts are used to identify them. Example: the long‑term uptrend of the S&P 500 index, which has lasted for more than a decade.
Intermediate‑term trends
Duration from several weeks to several months. They can be identified on daily and four‑hour timeframes. These trends are most often used by position traders and swing traders.
Short‑term trends
They can be sought on any timeframe – from five‑minute to hourly. They are preferred by scalpers and day traders. Such trends are subject to a lot of noise but offer many trading opportunities.
All these trends are present on the market simultaneously. For traders with small accounts, short‑term and intermediate‑term trends are usually suitable. For example, looking at the S&P 500 chart, we see a long‑term uptrend, inside which there are intermediate corrections and short‑term impulses.
Understanding which timeframe you are working on and being able to separate the long‑term trend from short‑term noise is a key skill. Many beginners make the mistake of trying to trade against the higher‑timeframe trend, which leads to losses. Always start your analysis with a weekly or daily chart to determine the main direction.
3. Thomas DeMark’s trend lines – removing subjectivity
Thomas DeMark is a well‑known trader and the author of many indicators used in professional platforms (Bloomberg, Reuters). He rightly noted that drawing trend lines is a highly arbitrary process. Different traders will draw trend lines differently on the same chart. Moreover, even the same trader, using the same chart at different times, may draw a trend line differently.
The reason for this ambiguity is that a trend line usually involves connecting several relative highs or relative lows. If only two such points are available, the trend line can be drawn precisely. However, when three or more points need to be connected, as often happens in reality, an exact line is possible only in the rare case where the relationship between them is strictly linear. In practice, the drawn trend line will accurately pass through at most one or two relative highs (or lows), missing the others. The “most correct” trend line exists only in the eye of the beholder.
«Trend lines should be drawn from right to left because recent price action is more important than past movement.»
DeMark offers clear, algorithmic definitions that eliminate subjectivity. He introduces the concepts of relative high and relative low, as well as true high / true low. The core idea: a trend line must be based strictly on two points – the two most recent significant extremes.
3.1. Key definitions according to DeMark
- Relative high – a high that is higher than the highs of N preceding and N following bars. N is a parameter that the trader chooses (e.g., 5, 10 or 20).
- Relative low – a low that is lower than the lows of N preceding and N following bars.
- True high – the greater of two values: the current high or the previous close.
- True low – the lesser of two values: the current low or the previous close.
Using true highs and lows helps smooth out gaps and take into account the context of the previous period. In most cases the true high coincides with the daily high, but when a downward gap occurs, the true high may become the previous day’s close.
3.2. Downward (bearish) trend line
The current downtrend line is defined as the line connecting the most recent relative high and the previous relative high, which must be higher than the most recent one. The latter condition ensures that the line is indeed sloping down. As soon as the price breaks this line from below – it is a signal of a possible trend change.
3.3. Upward (bullish) trend line
The uptrend line is defined as the line connecting the most recent relative low and the previous relative low, which must be lower than the most recent one. A break of this line from above warns of a possible reversal of the upward movement.
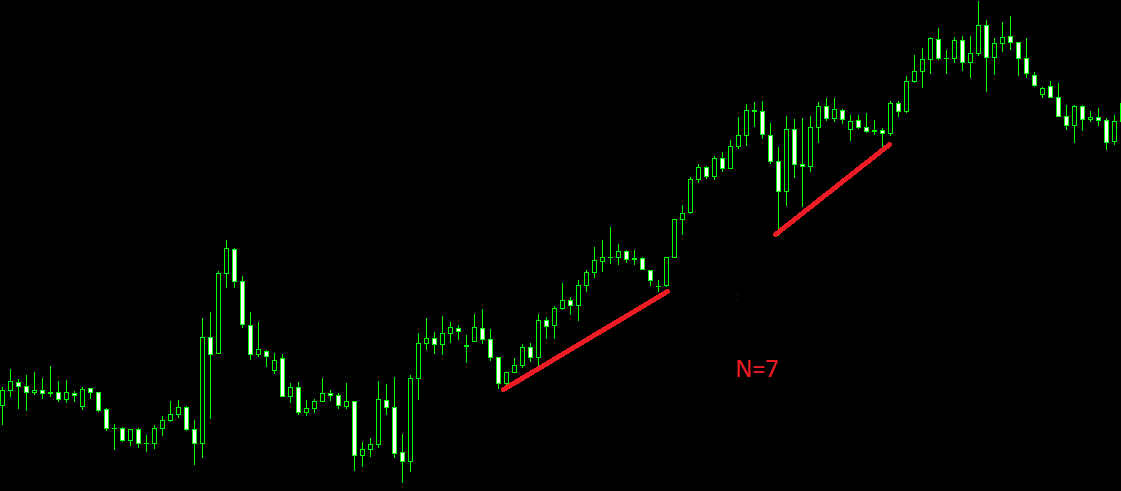
The advantage of DeMark’s method is that it provides a clear, reproducible algorithm. Any trader using the same N parameter will obtain identical trend lines. This is especially important for automated trading systems. However, DeMark emphasises that the choice of N is a matter of personal preference and trading style. Short‑term traders choose small N (e.g., 5 or 8), while long‑term traders choose larger ones (20, 30 or more).
DeMark’s methodology is not limited to trend lines. He also developed indicators such as TD Sequential, TD Combo, support/resistance levels and other tools widely used by professionals. If you are interested in this approach, we recommend reading his book “Technical Analysis – A New Science”.
Practical tips for drawing trend lines
To ensure that trend lines truly help your trading rather than mislead you, follow these rules:
- Use at least two touch points – the minimum for construction, but the reliability of a line increases with each new touch.
- Do not ignore the timeframe – a line drawn on a 5‑minute chart is less significant than one on a daily chart. Always start your analysis with higher timeframes.
- A trend line break is not always a reversal. In a strong trend, false breaks (noise) are possible. Wait for confirmation – a candle close beyond the line or a retest.
- Combine with other tools: moving averages, channels, Bollinger Bands.
Also remember that trend lines act as dynamic support and resistance. As long as the price stays above an upward trend line, bulls control the market. A fall below the line is a signal for caution.
Founder of technical analysis
«The trend exists until it gives clear signs that it has ended. Do not try to predict a reversal – wait for the signal.»