Chaikin Oscillator: Complete Guide to Using the Volume-Based Indicator
The Chaikin Oscillator is a powerful technical analysis tool that combines price and volume. It helps identify accumulation and distribution, spot divergences, and confirm trends. In this guide we will cover the calculation formula, signal interpretation, and practical trading strategies.
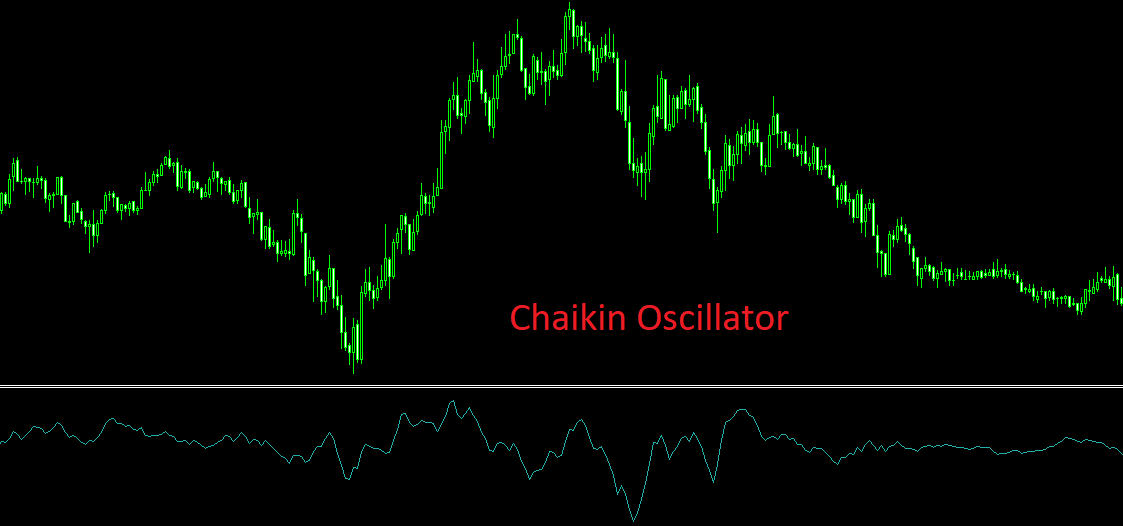
1. What is the Chaikin Oscillator?
The Chaikin Oscillator is a technical indicator developed by Marc Chaikin, a well‑known analyst and creator of the volume‑based accumulation/distribution concept. The indicator is based on analyzing changes in trading volume and price movement. Its main task is to identify accumulation (buyers entering the market) or distribution (sellers exiting), allowing traders to assess the real forces behind price movement. The key idea: volume changes precede price changes, so the Chaikin Oscillator often gives early signals of trend reversals.
Unlike many other oscillators (e.g., RSI or Stochastic), the Chaikin Oscillator takes volume into account, making it especially valuable for confirming trends and detecting divergences. It is derived from the Accumulation/Distribution Line (A/D Line), which sums weighted volume depending on the position of the closing price within the daily range.
«Volume is the energy of the market. The Chaikin Oscillator turns that energy into a clear signal, helping traders see when buyers or sellers are truly in control.»
2. Calculation Formula of the Chaikin Oscillator
The Chaikin Oscillator is calculated in two steps. First, the Accumulation/Distribution Line (A/D Line) is computed for each period, then the difference between two exponential moving averages (EMA) of this line is taken.
2.1. The A/D Line
The formula for the A/D line for a single bar (candle):
where:
- Close — closing price of the current period;
- Low — lowest price of the current period;
- High — highest price of the current period;
- Volume — trading volume of the current period.
The fraction ((Close − Low) − (High − Close)) / (High − Low) takes values from -1 to +1. It shows how close the close is to the high or low. A positive value (closer to the high) indicates buying pressure, a negative value (closer to the low) indicates selling pressure. Multiplying by volume gives a weighted accumulation/distribution value. The A/D Line accumulates these values from the beginning of the chart.
2.2. The Chaikin Oscillator
The Chaikin Oscillator is calculated as the difference between the 3‑period EMA of the A/D line and the 10‑period EMA of the A/D line:
The standard parameters are 3 and 10 periods (as proposed by Chaikin himself). However, traders can adapt them to their style (e.g., 5 and 13 for faster reaction). Positive oscillator values mean bulls (buyers) control the market, negative values mean bears (sellers). A zero‑line crossing signals a possible short‑term trend change.
3. Advantages of the Chaikin Oscillator
The Chaikin Oscillator offers traders unique capabilities:
- Identifying trend reversals — a quick change of sign (from + to - or vice versa) may warn of an upcoming reversal.
- Trend confirmation — if the oscillator moves in the same direction as price, it reinforces confidence in the continuation.
- Detecting divergences — a discrepancy between price and the oscillator (price makes a new extreme, but the oscillator does not) is one of the most reliable reversal signals.
- Identifying overbought/oversold zones — although the Chaikin Oscillator has no fixed levels, extreme values (e.g., above +1000 or below -1000 on stocks) may indicate temporary saturation.
Thanks to volume consideration, the Chaikin Oscillator is especially effective on liquid markets (large‑cap stocks, high‑turnover currency pairs, futures). It helps distinguish genuine trend moves from false spikes.
4. Applying the Chaikin Oscillator in Trading
There are several main ways to use the indicator.
4.1. Zero‑line crossover
The simplest signal: when the oscillator crosses the zero line from below to above — buy signal (bullish accumulation). When it crosses from above to below — sell signal (bearish distribution). However, such a signal often lags, so it is recommended to combine it with trend indicators (e.g., moving averages).
4.2. Trend confirmation
If price is rising and the oscillator is above zero and also rising — the trend is strong. If price is falling and the oscillator is below zero and falling — the downtrend is confirmed. When the oscillator starts to diverge from price (e.g., price rises but the oscillator falls), it is a warning of trend weakening.
4.3. Divergences
Bullish divergence (positive): price makes a new low, while the oscillator makes a higher low. This is a buy signal. Bearish divergence (negative): price makes a new high, while the oscillator makes a lower high. Sell signal. Divergences on the Chaikin Oscillator are considered particularly strong due to the inclusion of volume.
Important: divergences work better on higher timeframes (H4, D1, W1). On lower timeframes (M5, M15) there may be many false signals.
5. Trading Strategies with the Chaikin Oscillator
Let us consider three practical strategies.
5.1. Zero‑line crossover with trend filter
Conditions: Determine the trend using a long‑term moving average (e.g., 200 EMA). In an uptrend (price above 200 EMA), wait for the Chaikin Oscillator to cross the zero line from below to above — buy signal. In a downtrend (price below 200 EMA), wait for a cross from above to below — sell signal. Stop‑loss: beyond the last local low/high. Target: 2-3 ATR or a previous support/resistance level.
5.2. Divergence strategy
Conditions: Look for divergences on daily or 4‑hour charts. On a bullish divergence, open a long position after the oscillator starts to rise from the second low. On a bearish divergence, open a short position after the oscillator starts to fall from the second high. Stop‑loss: beyond the price extreme (above/below the divergence point). Target: the height of the preceding move or 1-2 ATR.
5.3. Combination with RSI or MACD
The Chaikin Oscillator complements oscillators that do not consider volume. For example, if RSI shows overbought (above 70) but the Chaikin Oscillator is still rising, the trend may continue. If RSI is overbought and the Chaikin Oscillator starts to fall — a strong reversal signal. Combining with MACD helps confirm momentum: when MACD gives a signal‑line crossover and the Chaikin Oscillator is above zero — the bullish signal is stronger.
«The best way to use the Chaikin Oscillator is not alone but in conjunction with trend indicators. It filters out false moves not supported by volume.»
6. Limitations and Drawbacks of the Chaikin Oscillator
Like any indicator, the Chaikin Oscillator is not perfect:
- Lag. EMAs introduce delay, so signals may come later than desired.
- False signals in illiquid assets. If volumes are unstable (e.g., cryptocurrencies on small timeframes), the oscillator may produce a lot of noise.
- Does not predict the size of the move. The indicator shows pressure strength but not how far price will go.
- Dependence on period choice. The standard 3 and 10 periods suit daily charts; for minute charts you need to experiment (e.g., 5 and 13).
To minimise false signals, always use the Chaikin Oscillator in combination with other tools and always check the higher timeframe.
Practical Tips for Using the Chaikin Oscillator
- Adjust the periods to your style. For intraday trading try (2,8) or (3,10). For long‑term try (5,13) or (10,21).
- Use the Chaikin Oscillator on multiple timeframes. A signal on H4 confirmed on D1 is much more reliable.
- Watch for extreme values. If the oscillator reaches historical highs/lows, prepare for a correction.
- Do not ignore real‑time volume. A sudden volume change without a change in the oscillator may indicate an imminent turn.
How Technology Enhances Chaikin Oscillator Analysis
Manual divergence hunting and volume oscillator analysis on many charts takes hours. Modern services like AemmTrader automatically calculate the Chaikin Oscillator on all timeframes, detect bullish and bearish divergences, and provide ready‑made signals with probability indication. The neural network analyses the indicator's history and predicts trend change moments when volume pressure subsides.
Using such tools, you can focus on strategy rather than calculations. This is the bridge between amateur and professional approaches — saving time and increasing efficiency.