Force Index: Complete Guide to Alexander Elder's Oscillator
The Force Index is an oscillator developed by Alexander Elder that combines price change and trading volume. It helps assess the strength of bullish or bearish momentum, spot divergences, and predict trend reversals. In this guide we will cover the calculation formula, signal interpretation, and practical trading strategies.
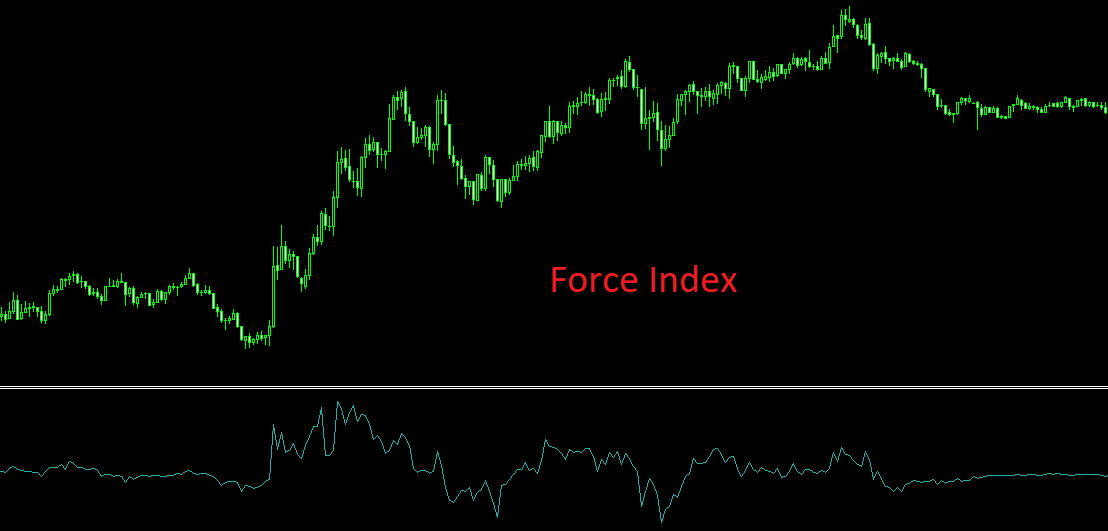
1. What is the Force Index?
The Force Index is a technical oscillator developed by renowned trader and psychologist Alexander Elder. It was first presented in his best‑selling book “Trading for a Living”. The main feature of the Force Index is that it takes into account not only price change but also trading volume. This allows traders to assess the real strength of buyers or sellers behind the price movement.
Unlike many other oscillators (e.g., RSI or Stochastic) that analyze only price, the Force Index adds volume measurement. The idea is simple: if price rises on high volume — bullish momentum is strong; if price falls on high volume — bearish momentum is strong. Decreasing volume while the trend continues may signal its weakening.
The Force Index is especially useful for confirming trends, finding divergences, and early detection of reversals. It can be applied to any market: stocks, forex, cryptocurrencies, commodities. However, due to its use of volume, on markets where volume data is unavailable or unreliable (e.g., OTC forex), its effectiveness decreases. In such cases, tick volume can be used as an approximation.
«The Force Index is the market's accelerometer. It shows how strongly bulls or bears are pushing price. If the push is weak, even if price moves in the right direction, a reversal is likely soon.»
2. Force Index Calculation Formula
The raw Force Index (without smoothing) is calculated using a very simple formula:
where:
- Volumet — trading volume of the current period (bar);
- Closet — closing price of the current period;
- Closet-1 — closing price of the previous period.
The product of volume and price change gives the strength of the move. A positive value means the closing price increased (bullish momentum), a negative value means price decreased (bearish momentum). The higher the absolute value, the stronger the momentum.
However, the raw Force Index is very volatile, so Alexander Elder recommended smoothing it with an exponential moving average (EMA). In practice, two variants are used:
- Short Force Index (EMA 2) — sensitive to short‑term changes, suitable for identifying entry points.
- Long Force Index (EMA 13) — smoother, shows the strength of the main trend, helps filter false signals.
The formula for the smoothed Force Index:
The standard periods proposed by Elder are 2 and 13. However, traders can adapt them to their style (e.g., 3 and 21).
3. Interpreting Force Index Values
Classic interpretation of the Force Index is based on sign and magnitude, as well as zero‑line crossovers and divergences.
3.1. Positive and negative values
- Positive values — bullish momentum: closing price higher than previous, buying pressure. The higher the value, the stronger the bulls.
- Negative values — bearish momentum: closing price lower than previous, selling pressure. The lower the value, the stronger the bears.
- Zero‑line crossover: when the Force Index crosses the zero line from below to above — change from bearish to bullish (buy signal). Cross from above to below — change from bullish to bearish (sell signal).
3.2. Assessing trend strength
The long Force Index (EMA 13) helps determine the strength of the main trend. If it remains positive and rising for a long time — the uptrend is strong. If it remains negative and falling — the downtrend is strong. If the long Force Index starts to decline even as price is still rising, it is a sign of trend weakening (bearish divergence).
3.3. Extreme values (overbought/oversold)
Although the Force Index has no fixed levels, extremely high or low values may indicate temporary saturation. For example, if the Force Index reaches a historical high, a correction is likely. For quantitative assessment, standard deviations or Bollinger Bands applied to the Force Index can be used.
4. Trading Strategies with the Force Index
Let us consider several proven strategies.
4.1. Zero‑line crossover strategy
Buy: when the Force Index crosses the zero line from below to above (change from bearish to bullish momentum). Sell: when it crosses from above to below. To filter false signals, it is recommended to use the long Force Index (EMA 13): open positions only in the direction of its trend. For example, if the long Force Index is positive, use only buy signals.
4.2. Divergence strategy
Divergence between price and the Force Index is one of the most reliable reversal signals. Bullish divergence: price makes a new low, while the Force Index (preferably the long EMA 13) makes a higher low. Buy signal. Bearish divergence: price makes a new high, while the Force Index makes a lower high. Sell signal. Divergences are especially strong on higher timeframes (H4, D1).
4.3. Combining the Force Index with moving averages
Determine the long‑term trend using EMA 200. In an uptrend (price above EMA 200), use only buy signals (zero‑line crossover from below or bullish divergence). In a downtrend (price below EMA 200), use only sell signals. This filters out false signals against the main trend.
4.4. Trading extreme values
When the Force Index reaches an extremely high value (e.g., +2 standard deviations) and then starts to decline, it is a sell signal. Similarly, an extremely low value followed by a rise is a buy signal. Extremes can be determined using Bollinger Bands applied to the Force Index.
«The best way to use the Force Index is not to try to guess the top, but to wait for a divergence. It says: “Momentum is fading, get ready for a reversal”.»
5. Divergences on the Force Index: How to Find and Use Them
Divergences are discrepancies between the direction of price movement and the direction of the oscillator. Thanks to its use of volume, the Force Index gives very reliable divergences.
- Classic bullish divergence: price makes two consecutive lows (the second lower than the first), while the Force Index (preferably smoothed) makes two lows (the second higher than the first). Buy signal. The longer the time between extremes, the stronger the signal.
- Classic bearish divergence: price makes two consecutive highs (the second higher than the first), while the Force Index makes two highs (the second lower than the first). Sell signal.
- Hidden divergence: used for trend continuation. Bullish hidden divergence — price makes a higher low, while the Force Index makes a lower low (signal to continue growth). Bearish hidden divergence — price makes a lower high, while the Force Index makes a higher high (signal to continue decline).
For finding divergences, it is recommended to use the long Force Index (EMA 13) as it is less noisy. Entry is made after the Force Index turns from the second extreme. Stop‑loss is placed beyond the price extreme, target is the previous level or 2-3 ATR.
6. Limitations and Drawbacks of the Force Index
Despite its power, the Force Index has several limitations:
- Dependence on volume. On markets where volume data is unavailable or unreliable (OTC forex), the indicator loses some of its informativeness. Tick volume can be used as an approximation.
- Noise on small timeframes. On minute charts, the Force Index can give many false signals due to random volume fluctuations. It is recommended to use it on timeframes from H1 and above.
- Lag. Like any oscillator, the smoothed Force Index (EMA 13) can give signals with a delay.
- Does not show trend direction. Requires combination with trend indicators (moving averages, ADX).
To minimise drawbacks, use the Force Index in combination with moving averages, higher‑timeframe analysis, and real‑time volume.
Practical Tips for Using the Force Index
- Choose EMA periods according to your style. For scalping and day trading use (2,13), for swing trading — (3,21), for long‑term — (5,34).
- Always confirm divergence signals. One divergence is a warning, two is a signal, three is almost a guarantee of a reversal.
- Watch real‑time volume. If the Force Index is rising but volume is falling, momentum is weakening.
- Do not use the Force Index in isolation. Combine it with support/resistance levels and candlestick patterns.
- Backtest your strategies. Before applying in real trading, test the effectiveness of your rules on historical data.
How Technology Enhances Force Index Analysis
Manual divergence hunting and volume oscillator analysis on many charts takes hours. Modern services like AemmTrader automatically calculate various oscillators on all timeframes, detect bullish and bearish divergences, and issue signals.
The neural network analyses history and predicts moments of momentum weakening, allowing you to enter trades at early stages of a reversal. Using such tools, you can focus on strategy rather than tedious calculations. This is the bridge between amateur and professional approaches — saving time and increasing efficiency.