ADX Indicator: Complete Guide to Average Directional Movement Index
The Average Directional Movement Index (ADX) is a powerful indicator created by Welles Wilder to measure trend strength. Unlike oscillators, ADX does not show direction but rather the intensity of movement. In this guide, we will break down the formula, +DI and -DI lines, value interpretation, and practical trading strategies with ADX.
1. What is the Average Directional Movement Index (ADX)?
Average Directional Movement Index (ADX) is a technical indicator developed by Welles Wilder and described in his book "New Concepts in Technical Trading Systems" (1978). ADX does not indicate trend direction (up or down) but measures its strength. ADX values range from 0 to 100, where levels above 25 usually signal a strong trend, and below 20 indicate sideways movement or no trend.
ADX consists of three lines:
- +DI (Positive Directional Indicator) — measures the strength of upward movement.
- -DI (Negative Directional Indicator) — measures the strength of downward movement.
- ADX — smoothed average of the difference between +DI and -DI, showing overall trend strength.
Unlike oscillators such as RSI or Stochastic, ADX is not overbought/oversold; instead, it helps the trader decide whether to apply trend strategies (high ADX) or switch to range trading (low ADX). ADX pairs well with trend indicators like moving averages or MACD.
"ADX doesn't tell you where the market is going. It tells you whether it's worth following at all. It's an indicator for those who want to trade only strong moves."
2. ADX Calculation Formula
Calculating ADX occurs in several steps and requires computing True Range (TR), directional movements (+DM and -DM), and then smoothing them.
2.1. True Range (TR)
True Range is the maximum of three values:
2.2. Directional Movement (+DM and -DM)
For each bar, positive and negative directional movement are calculated:
- +DM = Hightoday − Highyesterday, if this difference is positive and greater than Lowyesterday − Lowtoday; otherwise +DM = 0.
- -DM = Lowyesterday − Lowtoday, if this difference is positive and greater than Hightoday − Highyesterday; otherwise -DM = 0.
Thus, only the dominant direction of movement for the period is considered.
2.3. Smoothing and Calculation of +DI and -DI
The obtained TR, +DM, and -DM are smoothed using an exponential moving average (usually with a period of 14). Then the directional indicators are calculated:
-DI = (Smoothed -DM / Smoothed TR) × 100
2.4. Calculating ADX
ADX is calculated as the smoothed average of the absolute difference between +DI and -DI, normalized by their sum:
ADX = EMA(DX, period)
The standard period for ADX is 14. Increasing the period makes the indicator smoother but slower.
Visualization: ADX (solid line) and +DI (green) / -DI (red) lines below the price chart
3. Interpreting ADX Values
3.1. Trend Strength Levels
Commonly accepted ADX thresholds:
- 0–20: No trend or weak trend. The market is in a sideways range. Trend strategies are ineffective; it's better to use oscillators or range trading.
- 20–25: Transition zone. A trend is beginning to form but is not yet strong enough.
- 25–40: Strong trend. Ideal conditions for trend strategies (moving average trading, breakout levels).
- 40+: Very strong trend, often accompanied by high volatility. The trend may be overheated and close to a correction.
3.2. Interaction of +DI and -DI
The +DI and -DI lines indicate trend direction:
- When +DI > -DI — upward movement prevails. This is a bullish signal, especially with rising ADX.
- When -DI > +DI — downward movement prevails. This is a bearish signal.
- The crossover of +DI and -DI is often used as an entry signal: buy when +DI crosses above -DI, sell when it crosses below.
However, these signals are most reliable when ADX is above 20–25, confirming trend strength.
3.3. ADX Dynamics and Reversals
If ADX begins to decline after a prolonged rise, it may indicate weakening trend and possible consolidation or reversal. Traders may take profits or tighten stop‑losses at such moments.
4. Practical Trading Strategies with ADX
4.1. Trend Strategy on +DI/-DI Crossover with ADX Filter
Wilder's classic strategy:
- Wait for ADX to rise above 25 (confirmation of trend presence).
- If +DI crosses above -DI — open a long position.
- If +DI crosses below -DI — open a short position.
- Exit when ADX starts declining or +DI/-DI cross again in the opposite direction.
4.2. ADX as a Filter for Other Strategies
ADX works excellently as a "permission" filter. For example:
- Breakout levels: Enter a support/resistance breakout only when ADX > 20. This filters out false breakouts in sideways markets.
- Moving averages: Use fast/slow EMA crossovers only when ADX > 25.
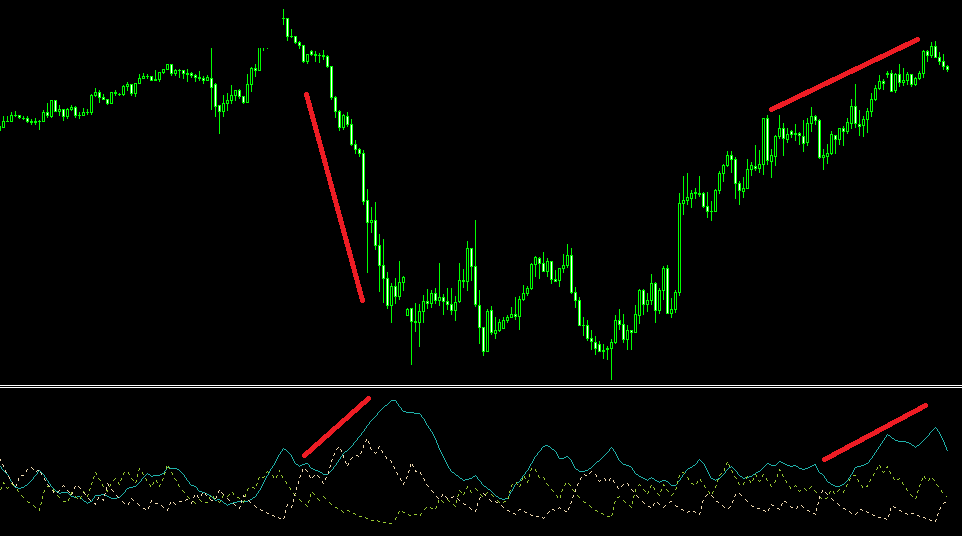
4.3. Divergences on ADX
Although ADX is not an oscillator, divergences with price can also be observed. For example, if price makes a new high but ADX forms a lower peak, it may signal weakening trend and an upcoming correction.
4.4. Combination with MACD
A strong signal: MACD gives a bullish crossover (MACD line above signal line) while ADX > 25 with +DI above -DI. This confirms that the upward momentum is supported by a strong trend.
5. Pros and Cons of ADX
Pros
- Objective trend strength assessment — clear numerical thresholds (20, 25, 40).
- Versatility — works on all markets and timeframes.
- False signal filtering — helps avoid trading in sideways markets.
- Easy interpretation — requires no complex calculations from the trader.
Cons
- Lag — ADX is based on moving averages, so signals arrive with delay.
- Does not show direction — must use +DI/-DI or other indicators.
- False signals on sharp moves — may give high values during volatile but non‑directional moves.
Forecasting and Technical Analysis with AEMMtrader
Manually tracking ADX, +DI/-DI crossovers, and divergences across dozens of instruments is a labor‑intensive task. The AemmTrader service is an intelligent platform for real‑time market analysis. We use ensembles of neural networks, automatic pattern recognition, and advanced technical analysis algorithms to give you a statistical edge.
Heart of the System: Neural Network Ensemble. We don't trust a single indicator. AEMMtrader's forecast is the result of consensus among dozens of independent mathematical models analyzing a window of the last 100 candles.
With AemmTrader, you only see those moments when the market is truly ready for a strong move. This saves time and increases your trading efficiency.