Average True Range (ATR): Complete Guide to Using in Trading
The Average True Range (ATR) is one of the most useful indicators for assessing volatility, managing risk, and setting stop‑losses. In this guide we will cover how ATR is calculated, how to apply it in various trading strategies, and how to combine it with other technical analysis tools.
1. What is Average True Range (ATR)?
Average True Range (ATR) is a technical indicator developed by J. Welles Wilder Jr. (author of RSI, ADX, Parabolic SAR) and first presented in his book “New Concepts in Technical Trading Systems” (1978). ATR measures market volatility by averaging the true range of price over a given period. Unlike many other indicators, ATR does not try to predict price direction — it focuses solely on the magnitude of fluctuations.
ATR is widely used by traders of all levels to assess market conditions, manage risk, and find optimal entry and exit points. This indicator is especially useful when trading volatile assets (cryptocurrencies, commodities, tech stocks) and for adaptive stop‑loss positioning.
«ATR doesn't tell you where the market is going. It tells you how strongly it is moving. That knowledge is the key to not being stopped out by random noise.»
2. ATR Calculation Formula
ATR calculation consists of three steps. First, the True Range (TR) is calculated for each period, then a moving average is taken.
2.1. True Range
The True Range is the greatest of three values:
- Current high minus current low (High − Low);
- Absolute value of current high minus previous close (|High − Closeprev|);
- Absolute value of current low minus previous close (|Low − Closeprev|).
This approach accounts for possible gaps and gives a more accurate volatility estimate than the simple High-Low range.
2.2. Calculating ATR
After obtaining TR values over N periods (standard N = 14), a moving average is calculated. For the first ATR value, the arithmetic mean of the first N TR values is used. Then exponential smoothing is applied using the formula:
where:
- ATRt — current ATR value;
- ATRt-1 — previous ATR value;
- TRt — true range of the current period;
- N — number of periods (usually 14).
Most trading platforms (MetaTrader, TradingView) calculate ATR automatically — the trader only needs to select the period and apply the indicator to the chart.
3. ATR Applications in Trading
ATR has many applications: from volatility assessment to dynamic position management. Let us look at the main ones.
3.1. Volatility assessment
High ATR values indicate strong volatility: prices move widely, creating opportunities for quick profits but also increasing risks. Low ATR values signal consolidation when the market is in a narrow range. Many traders use ATR to select suitable assets: if ATR is low, they switch to more volatile instruments.
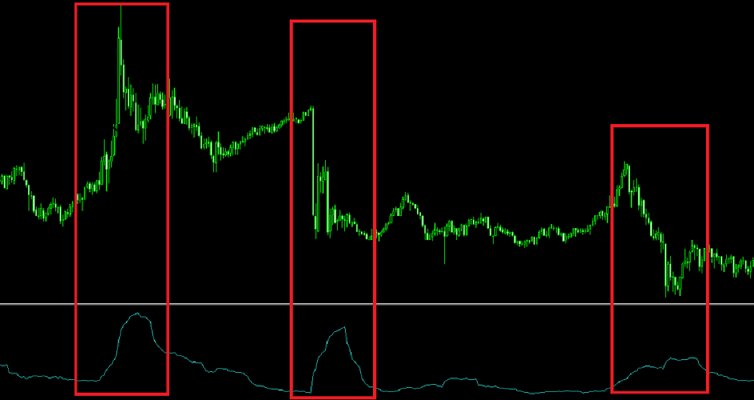
An increase in ATR after a quiet period often foreshadows the start of a new trend or an important news event. For example, before the release of inflation data or a Fed rate decision, ATR usually increases.
3.2. Risk management (stop‑loss and take‑profit)
One of the main advantages of ATR is helping to set adaptive stop‑losses. Instead of a fixed stop size (e.g., 50 pips), traders use an ATR multiplier. For example, a stop‑loss is placed at 1.5 × ATR from the entry price. This approach automatically accounts for current volatility: in calm markets the stop is tighter, in volatile markets it is wider, reducing the chance of being stopped out by random noise.
Profit targets can also be determined using ATR. For example, a 1:2 risk/reward ratio means that the take‑profit should be placed at 3 × ATR from entry (if stop is 1.5 × ATR). Some traders use sequential targets: first target — 1 × ATR, second — 2 × ATR, etc.
3.3. Combining ATR with other indicators
To increase signal accuracy, ATR is often combined with other tools:
- Moving averages (MA): rising ATR together with price above the moving average confirms trend strength. Falling ATR while the trend continues may signal weakening.
- RSI or Stochastic: if RSI shows overbought but ATR continues to rise, the trend may continue (strong move). If ATR falls, a reversal is likely.
- Support/resistance levels: zones 2-3 ATR away from the current price often serve as natural targets.
4. Trading Strategies Using ATR
There are several popular strategies based on ATR. Let us look at three main ones.
4.1. Breakout strategy
Idea: when price breaks an important level (e.g., the previous day‘s high) and ATR is rising, there is a high probability of a new trend beginning. Entry — immediately after the candle closes beyond the level. Stop‑loss — at 1.5 × ATR from entry. Target — 3 × ATR (1:2 risk/reward).
4.2. Counter‑trend strategy (on pullbacks)
For experienced traders: after a long move, ATR starts to decline and price candles narrow. This signals a possible reversal. Entry is made against the trend on a breakout of a level defined by ATR. Stop‑loss — beyond the recent extreme. This strategy requires patience and volume confirmation.
4.3. Scalping with ATR
Scalpers use ATR to define a “noise filter”. If ATR is high, the minimum move for a trade should be at least 0.5 × ATR. This helps avoid entering false micro‑movements. Take‑profit is often set at 1 × ATR, stop at 0.5 × ATR.
«ATR won't make you rich. But it will keep you from going broke. Use it to survive losing streaks and wait for your moment.»
5. Limitations and Drawbacks of ATR
Despite its usefulness, ATR has several limitations:
- Signal lag. Since ATR is a moving average, it reacts to volatility changes with a delay. This can be critical in fast‑moving markets.
- Does not predict direction. ATR only shows the magnitude of fluctuations, not where price will go. Therefore, it must be combined with trend indicators (moving averages, ADX).
- Sensitivity to extreme moves. One day with an abnormal gap can distort ATR for several periods. In such cases, using a median true range or increasing the period can help.
Despite these drawbacks, ATR remains one of the most popular tools for risk management. The key is to interpret its signals correctly and not use it in isolation.
Practical Tips for Using ATR
- Choose the period according to your trading style: for scalping and day trading — 5-10, for swing trading — 14-20, for long‑term investing — 20-50.
- Use an ATR multiplier for trailing stops. For example, move the stop‑loss by 2 × ATR behind the price. This protects profit and gives room for corrections.
- Compare ATR across different assets. This helps select the most volatile instruments for short‑term trading.
- Combine ATR with volume indicators. High ATR on rising volume is a strong signal of a trend start.
How Technology Enhances Volatility Analysis
Manual calculation of ATR and its combinations with other indicators is time‑consuming and error‑prone. Modern services like AemmTrader automatically compute ATR on all timeframes and integrate it into technical analysis signals. The platform provides forecasts based on an ensemble of neural networks, as well as adaptive stop‑loss and take‑profit recommendations based on current volatility.
The neural network analyses ATR history and predicts periods of increased volatility, allowing you to prepare in advance for sharp moves. This is especially useful for capital management: for example, before important news releases, the algorithm recommends reducing position size.
Using such tools, you can focus on strategy rather than calculations. This is the bridge between amateur and professional approaches — saving time and increasing efficiency.