Momentum Oscillator: Complete Guide to the Speed Indicator
Momentum is one of the simplest yet most powerful oscillators, measuring the rate of price change. In this article, we will break down the formula, signal interpretation, divergence detection, and practical trading strategies using Momentum.
1. What is the Momentum Oscillator?
Momentum is a technical indicator that measures the speed of price change of a financial instrument over a specified period. It belongs to the class of oscillators and helps traders assess the strength of the current trend, as well as identify moments when the market is moving too fast and may be ready for a correction or reversal.
The Momentum indicator has no upper or lower boundary; its values fluctuate around a center line (usually 100 when using the relative formula). Unlike oscillators such as RSI or Stochastic, Momentum is not confined to a 0–100 range, making it especially useful during strong trending moves.
The key idea of Momentum: when price rises too quickly, the market becomes "overheated" and a pullback is likely; when price falls too quickly, the market is "oversold" and a bounce is probable.
"Market speed is a crucial indicator of its health. Momentum helps you see when a move is losing strength even before it is reflected in price."
2. Momentum Calculation Formula
There are two main ways to calculate Momentum: subtractive (classic) and relative. Both are widely used, and the choice depends on trader preference and trading platform.
2.1. Subtractive Momentum
Calculated as the simple difference between the current closing price and the closing price n periods ago:
2.2. Relative Momentum (Rate of Change)
Represents the percentage change in price and is more convenient for comparing different instruments:
where Closecurrent is the current closing price, Closen is the closing price n periods ago. The most common parameter is n = 14 (14 days on a daily chart or 14 candles on any timeframe). With n=14, relative Momentum oscillates around 100: above 100 — price is higher than 14 periods ago (upward momentum), below 100 — price is lower (downward momentum).
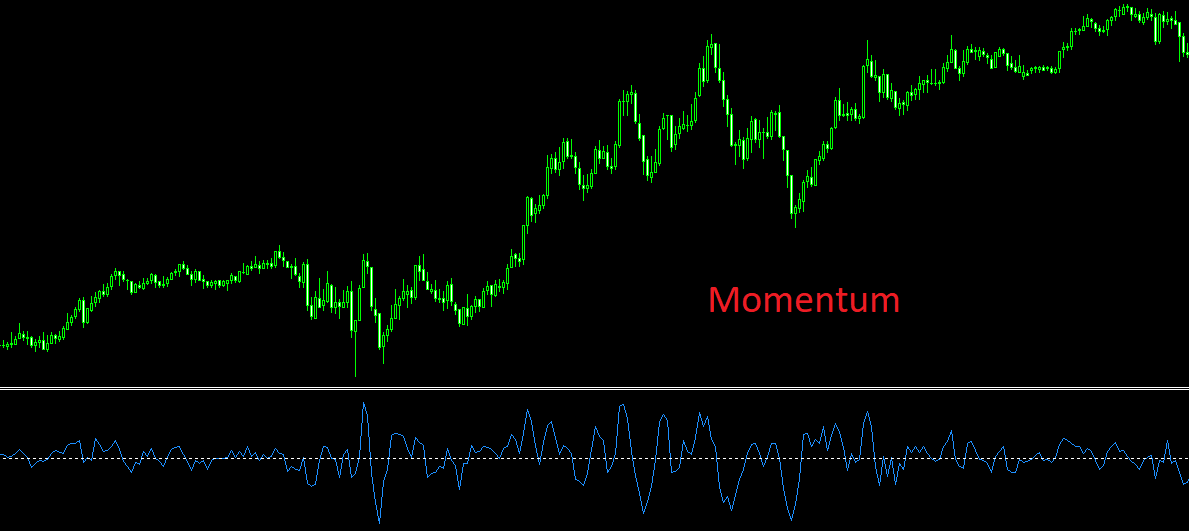
Visualization: Momentum indicator below the price chart
3. Interpreting Momentum Values
The classic approach to interpreting Momentum is based on analyzing the indicator's position relative to the center line (100 for relative Momentum or 0 for subtractive) and identifying extreme values.
3.1. Overbought and Oversold Levels
For relative Momentum (division by 100 formula), reference zones are:
- Above 105–110 — overbought zone, price has risen too quickly, a downward correction is possible.
- Below 90–95 — oversold zone, price has fallen too quickly, an upward bounce is possible.
It's important to understand that in a strong trend, Momentum can remain in overbought/oversold territory for an extended period, so reversal signals should be confirmed with other tools (e.g., moving averages or candlestick patterns).
3.2. Center Line Crossovers
Crossing above 100 signals emerging upward momentum and can be used as confirmation of a bullish trend. Crossing below 100 signals downward momentum. This method is often used in conjunction with trend indicators to filter false signals.
4. Momentum Divergences: A Powerful Reversal Signal
Divergence is a discrepancy between the direction of price and oscillator readings. Momentum is particularly sensitive to divergences, which often precede significant trend reversals.
Bullish Divergence
Situation: Price makes a lower low, but Momentum shows a higher low.
Meaning: Bearish momentum is weakening despite falling prices. Expect an upward reversal or strong correction.
Action: Prepare to buy; enter after confirmation (e.g., breakout of local resistance).
Bearish Divergence
Situation: Price makes a higher high, but Momentum shows a lower high.
Meaning: Bullish momentum is fading. Expect a downward reversal or deep correction.
Action: Prepare to sell; enter after confirmation (e.g., breakout of local support).
Divergence signals become more reliable when they form on higher timeframes (H4, D1) and are confirmed by other indicators such as CCI or MACD.
5. Practical Trading Strategies with Momentum
5.1. Trading Bounces from Levels
A classic strategy: when Momentum reaches extreme values (e.g., above 110 or below 90), the trader waits for a reversal and enters a position against the current move.
- Buy: Momentum drops below 90, then starts to rise. Enter when a candle confirming the indicator's rise closes. Stop-loss beyond the nearest low.
- Sell: Momentum rises above 110, then starts to decline. Enter when a candle confirming the indicator's decline closes. Stop-loss beyond the nearest high.
5.2. Combining Momentum with Moving Averages
Adding a trend filter significantly improves Momentum's effectiveness. Use a 200-period exponential moving average (EMA 200) to determine the overall trend:
- If price is above EMA 200 — uptrend. Ignore sell signals; consider only buys (Momentum exiting oversold or bullish divergences).
- If price is below EMA 200 — downtrend. Ignore buy signals; consider only sells (Momentum exiting overbought or bearish divergences).
5.3. Momentum + RSI: Double Confirmation
Combining two oscillators — Momentum and RSI — helps filter false signals. For example, a buy signal is considered strong when Momentum exits the oversold zone and RSI rises above 30 simultaneously. Similarly for a sell signal: Momentum exits overbought and RSI falls below 70.
"Momentum is the market's speedometer. But remember: high speed does not mean an immediate crash. The market can move fast much longer than you expect."
6. Pros and Cons of Momentum
Pros
- Simplicity and clarity — easy to understand and apply even for beginners.
- Leading nature — divergences warn of reversals in advance.
- Versatility — works on all markets and timeframes.
- No rigid boundaries — doesn't "stick" in overbought/oversold zones during strong trends.
Cons
- False signals in sideways markets — frequent level crossovers without follow-through.
- No fixed overbought/oversold levels — levels must be adjusted per instrument.
- Lag on higher periods — with large n, signals arrive with delay.
How Technology Enhances Momentum Analysis
Manually tracking Momentum across dozens of instruments and searching for divergences consumes valuable time. The service AemmTrader automatically calculates Momentum on all timeframes, identifies extreme values and divergences, and combines signals with other oscillators (RSI, MACD, CCI) to improve accuracy.
The platform uses ensembles of neural networks that analyze the last 100 candles and run 30 Monte Carlo simulations to forecast probable price movement. Momentum signals are filtered through a multi-timeframe analysis matrix (from M5 to D1) and confirmed by a graphic pattern scanner. Dynamic Stop Loss and Take Profit levels are calculated based on the ATR indicator.
Using such tools, you focus on strategy, not routine. It's a bridge between amateur and professional approaches — saving time and increasing efficiency.