Parabolic SAR: Complete Guide to Stop-and-Reversal
Parabolic SAR (Stop-and-Reversal) is a trend indicator developed by Welles Wilder in the 1970s. It displays potential price reversal points as dots above or below the chart. In this guide, we will break down the formula, settings, signals, and trading strategies with Parabolic SAR.
1. What is Parabolic SAR?
Parabolic SAR (Stop-and-Reversal) is a technical indicator created by Welles Wilder and described in his book "New Concepts in Technical Trading Systems" (1978). SAR stands for "Stop and Reverse," reflecting the indicator's primary function: to identify moments when the current trend is likely to end and it is time to close a position or reverse direction.
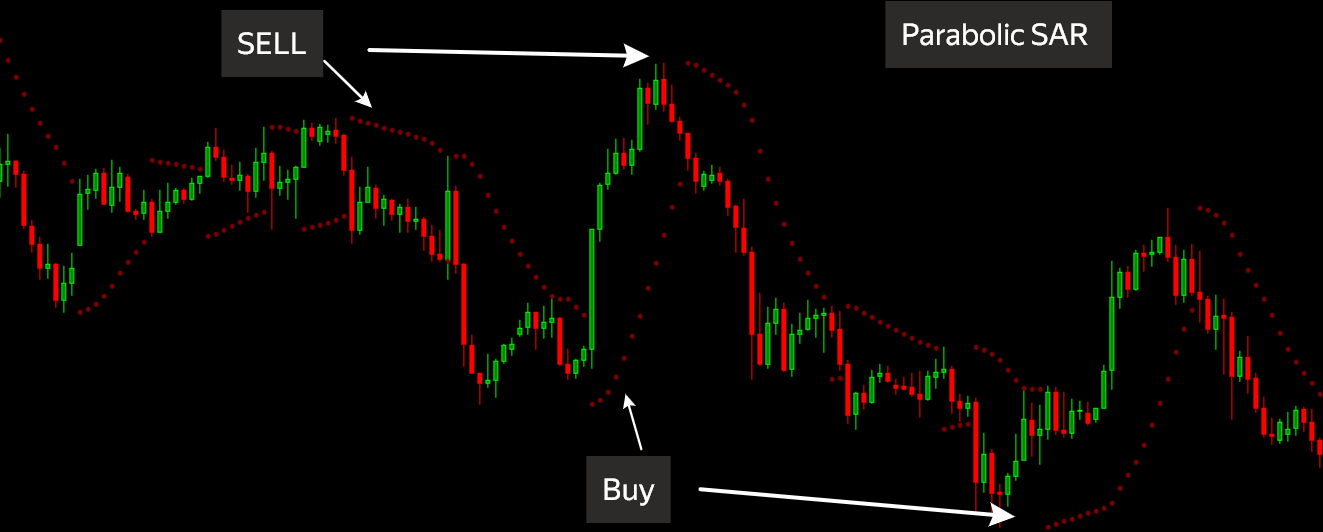
On a chart, Parabolic SAR appears as a series of dots placed either below the price (during an uptrend) or above the price (during a downtrend). When the price crosses the SAR dots, it signals a potential trend reversal. Thanks to its clarity, the indicator is often used to set dynamic stop-loss levels.
Unlike oscillators such as the RSI or Stochastic, Parabolic SAR is a purely trend‑following tool. It works best in directional moves and can produce many false signals in sideways markets. Therefore, it is recommended to combine it with other indicators, for example, moving averages or the MACD.
"Parabolic SAR is a unique tool that not only tells you when to enter the market, but also when to exit. It disciplines the trader and protects against excessive losses."
2. Parabolic SAR Calculation Formula
The SAR dots are calculated recursively. For each subsequent period, the SAR value is computed based on the previous value and the Extreme Point (EP) of the current trend.
where:
- SARnext — the SAR dot value for the next period;
- SARcurrent — the current SAR dot value;
- AF (Acceleration Factor) — the acceleration factor;
- EP (Extreme Point) — the highest price during the current uptrend or the lowest price during the current downtrend.
The Acceleration Factor AF starts at the Acceleration Step value (usually 0.02) and increases by that amount each time the price reaches a new extreme (EP). The maximum value of AF is capped by the Maximum AF parameter, which defaults to 0.2.
This mechanism causes the SAR dots to gradually "catch up" with the price: the longer the trend lasts and the further the price moves, the faster the indicator approaches it, signaling a possible reversal.
Visualization: SAR dots below price in a bullish trend, above price in a bearish trend
3. Parabolic SAR Signals and Trading Strategies
3.1. Basic Reversal Signals
Classic Parabolic SAR signals:
- Bullish reversal: SAR dots flip from above the price to below the price — buy signal.
- Bearish reversal: SAR dots flip from below the price to above the price — sell signal.
Important: the signal is considered confirmed only after the candle on which the crossover occurs closes.
3.2. Using SAR as a Dynamic Stop-Loss
One of the most popular uses of Parabolic SAR is placing stop orders at the level of the most recent SAR dot. For example, if a long position is open, the stop-loss is placed just below the current SAR dot. As the price moves upward, the SAR dots also rise, automatically trailing the stop-loss and protecting profits.
3.3. Combining with a Trend Filter (EMA 200)
To filter out false signals in sideways markets, add a 200‑period exponential moving average (EMA 200):
- Price above EMA 200 — uptrend. Consider only bullish SAR signals (dots flipping below price).
- Price below EMA 200 — downtrend. Consider only bearish SAR signals (dots flipping above price).
3.4. Parabolic SAR + MACD
A buy signal is considered strong if SAR gives a bullish reversal while the MACD is above the zero line or gives a bullish crossover. Similarly for a sell signal — SAR flips downward and the MACD is below zero.
4. Parabolic SAR Parameter Settings
Standard indicator settings: Acceleration Step = 0.02, Maximum AF = 0.2. These values suit most markets, but they can be adapted to a specific trading style.
4.1. Acceleration Step
- Less than 0.02 (e.g., 0.01): SAR dots move more smoothly, reversals occur less frequently. Suitable for long‑term trends and conservative trading.
- Greater than 0.02 (e.g., 0.03‑0.04): dots approach price faster, making the indicator more sensitive. Suitable for aggressive trading on volatile instruments (cryptocurrencies).
4.2. Maximum AF
- Less than 0.2 (e.g., 0.1): limits how fast SAR dots approach price, reducing false reversals.
- Greater than 0.2 (e.g., 0.25‑0.3): allows dots to "catch up" with price even faster, providing earlier signals but increasing the risk of false triggers.
It is recommended to test parameters on historical data for each specific instrument.
5. Pros and Cons of Parabolic SAR
Pros
- Simplicity and clarity — signals are easy to read, even for beginners.
- Clear stop‑loss levels — SAR dots serve as natural protection levels.
- Effectiveness in strong trends — allows holding a position through most of the move.
- Versatility — works on all markets and timeframes.
Cons
- False signals in sideways markets — generates many losing reversals during consolidation.
- Lag during sharp moves — may give a reversal signal with a delay.
- Settings dependency — requires parameter tuning for each specific asset.
Automated Trailing Stop with AemmTrader
Parabolic SAR is an ideal candidate for automation. Manually tracking dot flips across dozens of charts is tedious, and dynamically setting stop‑losses based on SAR requires discipline. The AemmTrader service solves this problem: the platform automatically calculates SAR on all timeframes, alerts on reversals, and can even dynamically manage stop orders based on the current dot positions.
The AemmTrader neural network ensemble analyzes not only SAR signals but also market context: trend strength (ADX), volatility (ATR), and the behavior of related indicators. This helps filter out false reversals typical of sideways markets and focus only on quality setups.
With AemmTrader, you turn SAR from a simple indicator into a full‑fledged risk management system that works 24/7.