MACD Indicator: Moving Average Convergence Divergence
Moving Average Convergence Divergence (MACD) is a unique tool created by Gerald Appel that combines the properties of a trend-following indicator and an oscillator. In this guide, we will break down the formula, settings, types of signals, and trading strategies for MACD.
1. What is the MACD Indicator?
Moving Average Convergence Divergence (MACD) is an indicator developed by Gerald Appel in the late 1970s. Unlike classic oscillators (RSI or Stochastic), MACD does not have fixed overbought/oversold boundaries (0–100). It continues to rise or fall along with prices as long as the trend accelerates.
The uniqueness of MACD lies in its dual nature:
- As a trend indicator: MACD shows the direction and strength of movement by tracking the difference between fast and slow moving averages.
- As an oscillator: The MACD histogram measures the acceleration or deceleration of this difference, helping to identify moments of weakening momentum.
"MACD is perhaps the most elegant trend-following indicator that is also sensitive to changes in speed. It doesn't just tell you *where*, but also *how fast*."
2. MACD Formula and Components
The MACD indicator is built on three exponential moving averages (EMA). The standard settings (12, 26, 9) were chosen by Appel himself and are still considered classic.
2.1. MACD Line (Fast Line)
Calculated as the difference between the 12-period and 26-period exponential moving average of the closing price.
2.2. Signal Line
This is a 9-period exponential moving average of the MACD Line itself. It smooths the fast line and generates trading signals.
2.3. MACD Histogram
The histogram visualizes the distance between the fast MACD line and the slow signal line. It shows trend acceleration.
When histogram bars grow above zero, bullish momentum strengthens. When bars shrink (even if price is still rising), momentum fades and a correction may occur.
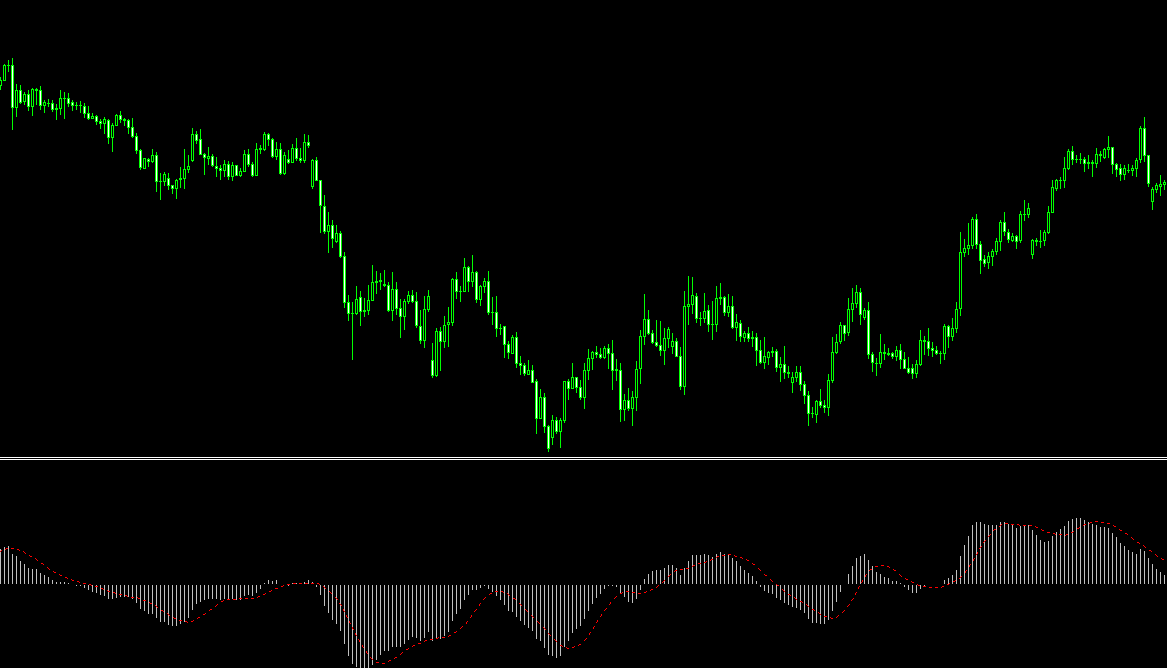
Visualization: fast line, slow signal line, and histogram bars
3. Main Trading Signals
3.1. Line Crossovers
Classic signals:
- Bullish Signal (Buy): MACD Line crosses above the Signal Line.
- Bearish Signal (Sell): MACD Line crosses below the Signal Line.
Important: In sideways markets (flat), these crossovers produce many false signals. Professionals filter them using higher timeframes or divergences.
3.2. Zero Line Crossovers
The zero line on MACD corresponds to the moment when fast EMA(12) equals slow EMA(26).
- MACD crossing above zero — confirms an uptrend (golden cross).
- MACD crossing below zero — confirms a downtrend (dead cross).
Zero line crossovers are stronger but lag more than signal line crossovers.
4. MACD Divergences: The Strongest Signal
Divergence is a discrepancy between price direction and oscillator readings. On MACD, divergences are best tracked using the histogram, not the line.
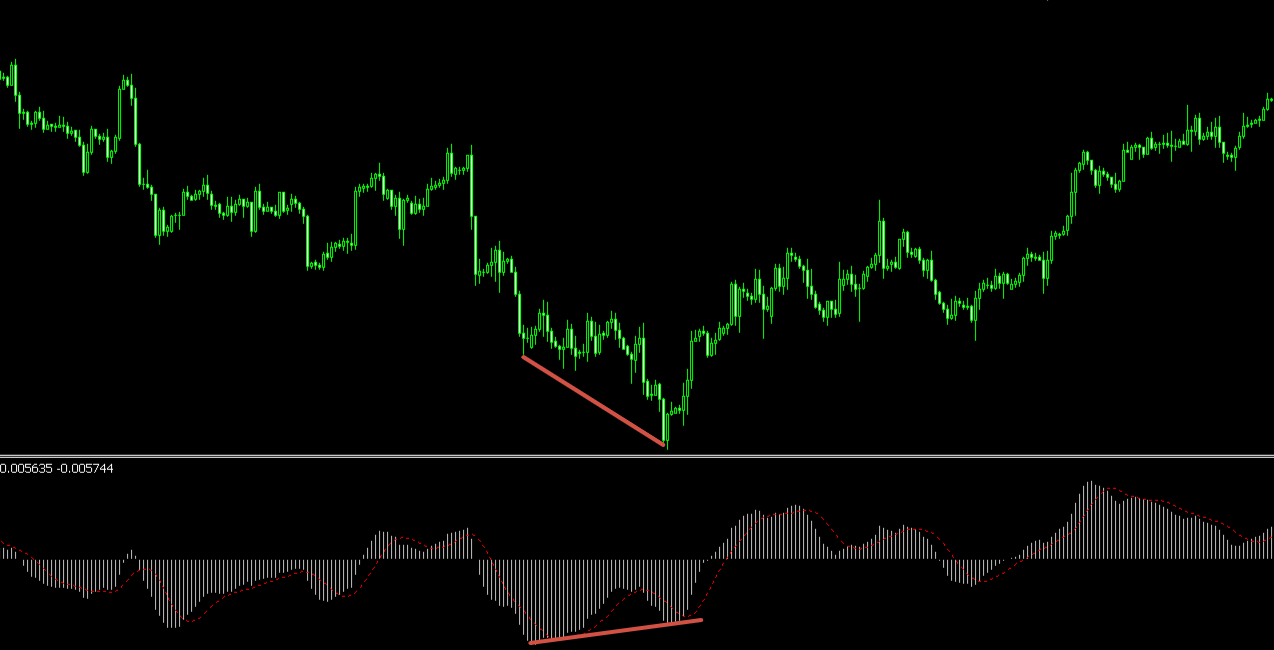
Bullish Divergence
Situation: Price makes a lower low, but the MACD histogram shows a higher low.
Meaning: Bears are losing strength. Expect an upward reversal or strong correction.
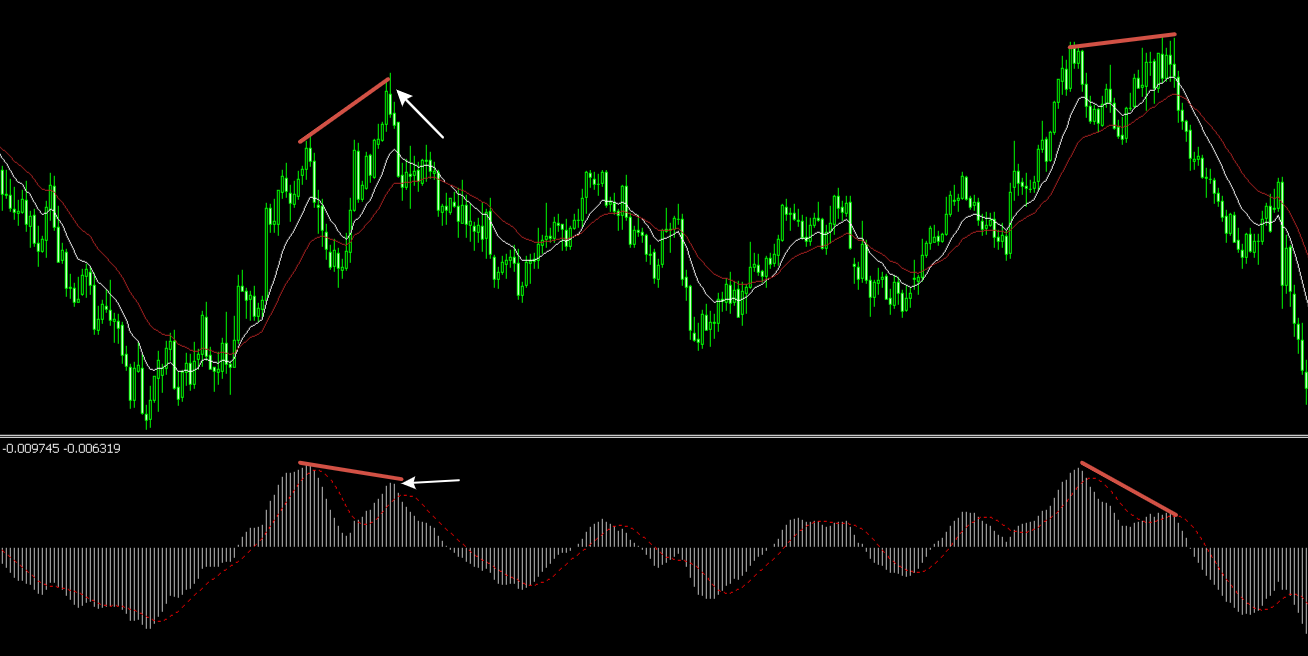
Bearish Divergence
Situation: Price makes a higher high, but the MACD histogram shows a lower high.
Meaning: Bulls are exhausting. Expect a downward reversal or deep correction.
Divergence is a leading signal. It doesn't give an exact entry point but warns you to close current trend positions or prepare for a reversal. Enter the market only after confirmation (e.g., trendline breakout or MACD line crossover).
5. Practical MACD Strategies
5.1. "Trend + Pullback" Strategy
On a higher timeframe (H4 or D1), determine the global trend using MACD's position relative to zero.
- If MACD is above zero — look only for buys.
- On a lower timeframe (M15 or H1), wait for the histogram to drop below zero and start rising (end of local correction).
- Enter when the fast MACD line crosses above the signal line.
5.2. Combining with Support/Resistance Levels
The most reliable MACD signals occur when a crossover or divergence coincides with a touch of an important price level. For example, if price touches a trendline and at that moment MACD forms a bullish divergence — that's a powerful entry signal.
"The biggest beginner mistake is entering against the trend just because the histogram has become lower or higher. MACD can remain overbought for a long time in a strong trend."
How Technology Enhances MACD Analysis
Manually searching for divergences on the MACD histogram and tracking crossovers across multiple charts takes hours. The modern service AemmTrader automatically calculates MACD on all key timeframes, detects bullish and bearish divergences, and delivers signals in real time.
The platform uses ensembles of neural networks that analyze the last 100 candles and run 30 Monte Carlo simulations to forecast movement. MACD signals are filtered through a multi-timeframe analysis matrix (from M5 to D1) and confirmed by a graphic pattern scanner. Dynamic Stop Loss and Take Profit levels are calculated based on the ATR indicator.
Using such tools, you focus on strategy, not routine. It's a bridge between amateur and professional approaches — saving time and increasing efficiency.