RSI Indicator: Complete Guide to Relative Strength Index
The Relative Strength Index (RSI) is one of the most popular oscillators, created by Welles Wilder in 1978. In this guide, we will break down the formula, level interpretation, divergence signals, and practical trading strategies using RSI.
1. What is the Relative Strength Index (RSI)?
The Relative Strength Index (RSI) is an oscillator developed by Welles Wilder Jr. and introduced in his book "New Concepts in Technical Trading Systems" (1978). RSI measures the speed and magnitude of recent price changes to determine overbought and oversold conditions of an asset.
Unlike many other oscillators, RSI has a fixed range of values from 0 to 100, making its interpretation uniform across all markets and timeframes. Traditionally, values above 70 indicate overbought conditions, while values below 30 indicate oversold conditions.
RSI pairs excellently with other technical analysis tools: trend lines, chart patterns, support and resistance levels, as well as moving averages. This allows traders to obtain more reliable signals and filter out false triggers.
"RSI is not just an overbought and oversold indicator. Its true power is revealed when looking for divergences and analyzing support and resistance levels on the oscillator itself."
2. RSI Calculation Formula
Calculating RSI occurs in several steps. First, the average gain and average loss over a chosen period (default 14) are computed.
2.1. Average Gain and Average Loss
For each period (e.g., a day), the change in closing price relative to the previous one is calculated. If the price rose, the change is considered positive and added to the sum of gains; if it fell, it is added to the sum of losses (in absolute value).
Average Loss = Sum of Losses over N periods / N
Wilder used a smoothed moving average to update values on each new bar:
Average Loss = ((Previous Average Loss × (N−1)) + Current Loss) / N
2.2. Relative Strength (RS) and RSI
Relative Strength (RS) is the ratio of average gain to average loss:
RS is then converted to a value between 0 and 100 using the formula:
The standard period for RSI is 14, as proposed by Wilder himself. However, traders often use shorter periods (5, 7, 9) for increased sensitivity on lower timeframes or longer periods (21, 28) to smooth signals on higher timeframes.
3. Interpreting RSI Values
3.1. Overbought and Oversold Levels
Classic boundaries proposed by Wilder:
- RSI above 70 — overbought zone. Price has risen too quickly; a downward correction is likely.
- RSI below 30 — oversold zone. Price has fallen too quickly; an upward bounce is likely.
In a strong trend, RSI can remain in overbought territory (during an uptrend) or oversold territory (during a downtrend) for an extended period. Therefore, entry signals based solely on reaching these levels should be confirmed by other methods — for example, a trendline breakout on the RSI itself or divergences.
Some traders adjust levels to 80 and 20 to filter false signals or, conversely, to 60 and 40 in weak trend conditions.
3.2. Crossing the Center Line (50)
The 50 level acts as a watershed between bullish and bearish sentiment:
- RSI crossing from below to above 50 — confirmation of upward momentum, a buy signal.
- RSI crossing from above to below 50 — confirmation of downward momentum, a sell signal.
3.3. Support and Resistance Levels on RSI
On the RSI chart itself, support and resistance levels often form, and their breakout can precede price movement. For example, if RSI breaks a descending resistance line on the oscillator, it often precedes a bullish breakout on the price chart.
4. RSI Divergences: The Most Reliable Signals
Divergence is a discrepancy between the direction of price and the direction of the oscillator. RSI is considered one of the best indicators for spotting divergences.
Bullish Divergence
Situation: Price makes a lower low, but RSI forms a higher low.
Meaning: Bearish momentum is weakening. Expect an upward reversal or strong correction.
Action: Prepare to buy; enter after confirmation (e.g., breakout of local resistance).
Bearish Divergence
Situation: Price makes a higher high, but RSI forms a lower high.
Meaning: Bullish momentum is fading. Expect a downward reversal or deep correction.
Action: Prepare to sell; enter after confirmation (e.g., breakout of local support).
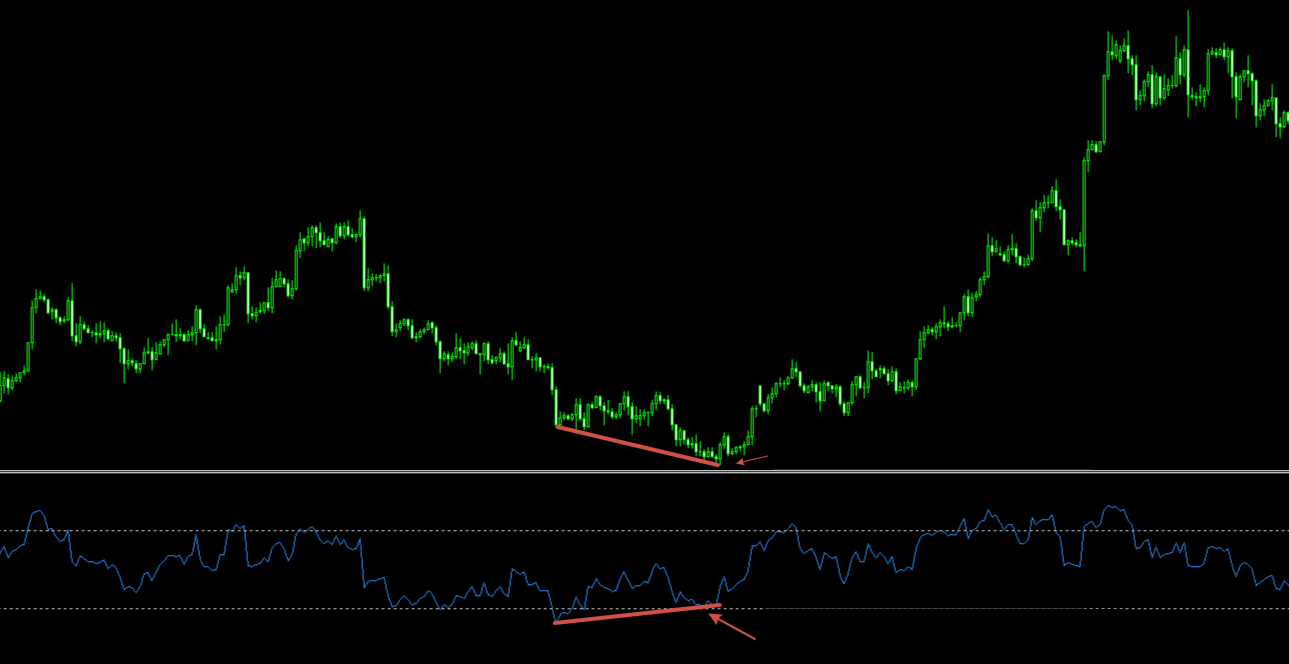
Example of bullish divergence: price falls, RSI rises
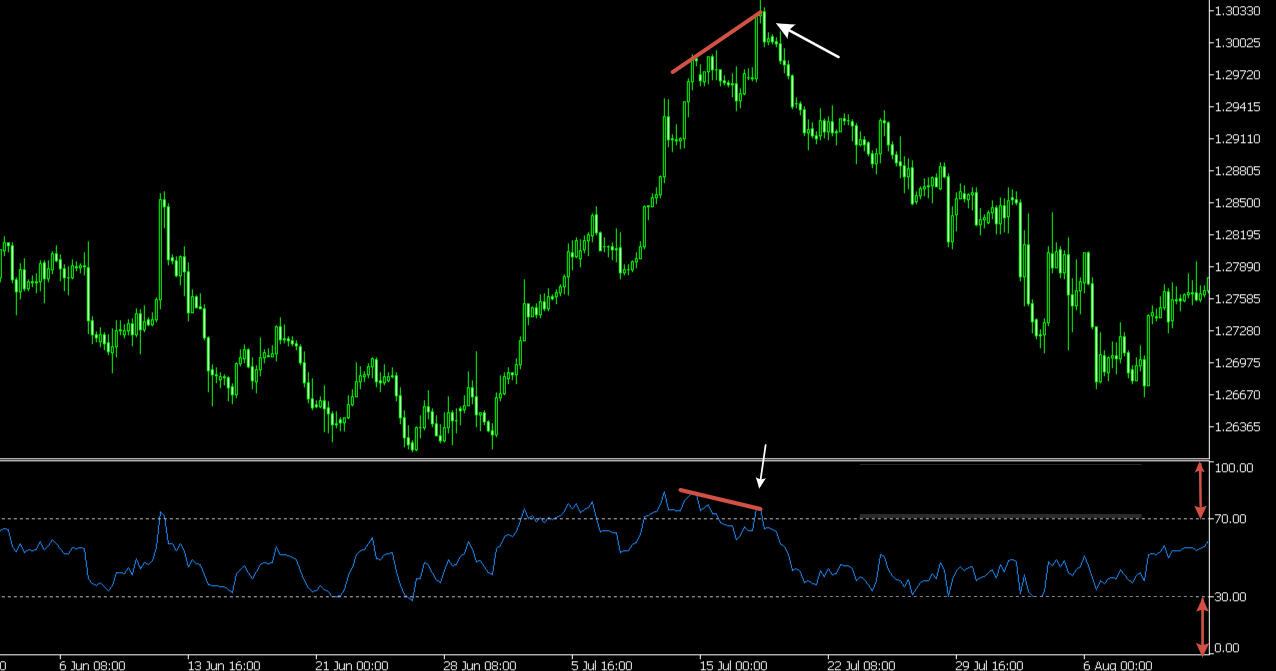
Example of bearish divergence: price rises, RSI falls
Divergence reliability increases when they form on higher timeframes (H4, D1) and are confirmed by other indicators such as MACD or CCI.
5. Practical Trading Strategies with RSI
5.1. Exiting Overbought/Oversold Zones
A more reliable signal than simply reaching the 70 or 30 levels is RSI exiting these zones.
- Buy: RSI falls below 30 (oversold zone) and then rises back above 30. Enter when a candle confirming the return above 30 closes.
- Sell: RSI rises above 70 (overbought zone) and then falls back below 70. Enter when a candle confirming the drop below 70 closes.
5.2. RSI + Moving Averages
Adding a trend filter, such as a 200-period exponential moving average (EMA 200), significantly improves the effectiveness of RSI signals:
- Price above EMA 200 — uptrend. Consider only buy signals (RSI exiting oversold zone or bullish divergences).
- Price below EMA 200 — downtrend. Consider only sell signals (RSI exiting overbought zone or bearish divergences).
5.3. Combining RSI with Support/Resistance Levels
The strongest RSI signals occur when a level crossover or divergence coincides with price touching an important horizontal level or trend line. For example, if price tests a support level and RSI forms a bullish divergence at the same time, it provides a powerful buy signal.
"RSI is not a crystal ball. But when you see a divergence on the daily chart, you should at least consider reducing your position or taking profits."
6. Pros and Cons of RSI
Pros
- Easy interpretation — fixed 0–100 range is intuitive.
- Versatility — works on all markets (forex, stocks, cryptocurrencies).
- Effective on divergences — provides strong leading signals.
- Good compatibility — combines well with trend indicators and chart analysis.
Cons
- False signals in strong trends — RSI can remain in overbought/oversold territory for extended periods.
- Lagging — like any oscillator, RSI provides signals with some delay.
- Requires confirmation — rarely used in isolation; needs additional filters.
RSI Automation: From Routine to Strategy
Experienced traders know: real RSI signals are often hidden among the noise. Manually searching for divergences across multiple assets is like looking for a needle in a haystack. The AemmTrader service takes on this task. The platform's algorithms continuously scan charts, instantly highlighting moments when RSI enters overbought/oversold zones or forms divergences with price.
Unlike standard indicators in a trading terminal, AemmTrader doesn't just display an RSI line. The system analyzes oscillator behavior in the context of the global trend, taking into account readings from higher timeframes. You receive not raw data but ready-made trade ideas with calculated risk levels based on current market volatility.
Stop spending hours on mechanical analysis. Focus on decision-making, and let algorithms handle pattern detection. This is not a replacement for a trader's experience but its enhancement.