Adaptive Moving Average: complete guide to the AMA indicator
The Adaptive Moving Average (AMA), developed by Perry Kaufman, automatically adjusts to market volatility. Unlike regular moving averages, AMA smooths out noise in sideways markets and accelerates during trends. In this guide we will cover the formula, settings, signals and trading strategies with AMA.
1. What is the Adaptive Moving Average (AMA)?
Adaptive Moving Average (AMA) is a technical indicator created by Perry Kaufman and introduced in his book “New Trading Systems and Methods” (1995). The main goal of AMA is to solve the core problem of traditional moving averages: they are either too slow (long period) or too noisy (short period). AMA dynamically changes its smoothing constant based on market volatility: in quiet markets it becomes slower, filtering false moves, while during strong trends it accelerates to keep up with price.
Unlike classic moving averages (SMA or EMA), AMA uses an Efficiency Ratio (ER) that measures the directionality of price movement. The more directional the market, the faster AMA reacts. This makes it especially useful for volatile instruments such as cryptocurrencies or technology stocks.
AMA works well with oscillators like RSI or Stochastic, as well as with support and resistance levels, enabling traders to obtain more precise entry and exit signals.
“The main advantage of adaptive methods is the ability to automatically adjust to market conditions, reducing lag in trends and filtering noise in sideways markets.”
2. Adaptive Moving Average calculation formula
AMA is based on the calculation of the Efficiency Ratio (ER) and the scaled Smoothing Constant (SC). The calculation occurs in three steps.
2.1. Efficiency Ratio (ER)
ER measures how directional price movement has been over the selected period. It equals the net price change divided by the sum of absolute changes for each period:
where n is the calculation period (default 10 or 14). ER ranges from 0 to 1: 1 means perfectly directional movement (trend), 0 means no direction (sideways).
2.2. Scaled Smoothing Constant (SC)
The obtained ER is scaled into a smoothing constant that determines how quickly AMA will react to new prices:
where fast and slow are constants corresponding to fast and slow EMA periods. Typically fast = 2 / (2 + 1) = 0.6667, slow = 2 / (30 + 1) = 0.0645. Squaring adds further smoothing.
2.3. Final AMA formula
The AMA value for the current bar is calculated recursively, similar to an EMA, but with a dynamic weight SC:
When the market is trending (ER close to 1), SC approaches fast, and AMA quickly follows price. In a sideways market (ER close to 0), SC tends toward slow, and AMA becomes almost horizontal, filtering noise.
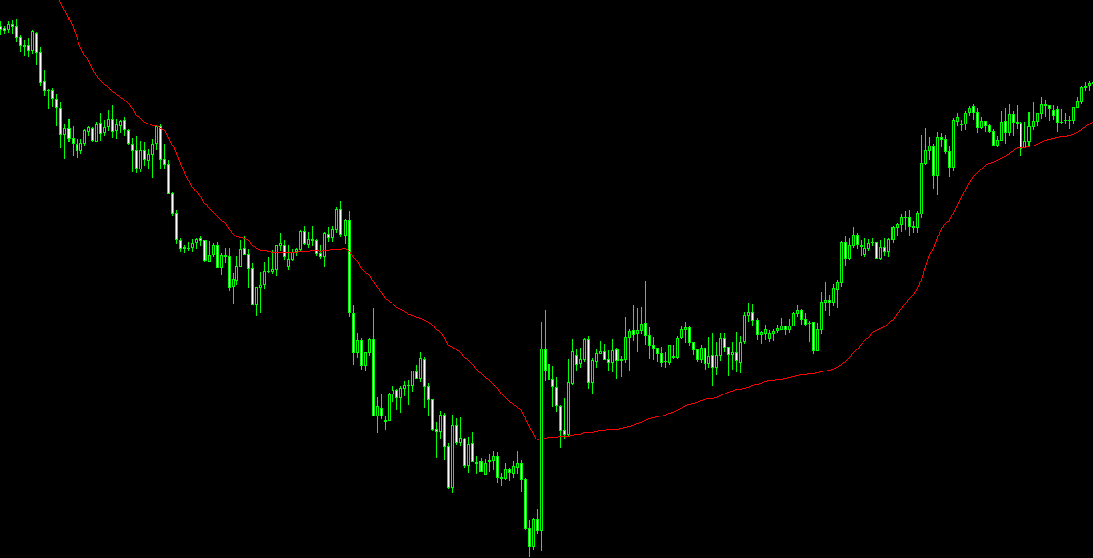
Visualization: AMA (red line) adjusts to volatility – smoothing in sideways markets and accelerating in trends
3. AMA signals and trading strategies
3.1. Price‑AMA crossovers
As with regular moving averages, the primary AMA signal is the crossover of price and the indicator line:
- Bullish signal (buy): price crosses AMA from below. This suggests that upward momentum has strengthened and the trend may continue.
- Bearish signal (sell): price crosses AMA from above. This indicates strengthening downward movement.
Thanks to its adaptivity, AMA signals in trending markets appear earlier than those of an SMA with a similar period, while in sideways markets the number of false crossovers is significantly lower than with a fast EMA.
3.2. AMA slope and trend change
A change in the slope of the AMA line may precede a trend reversal. If after a prolonged rise AMA starts to flatten or bend downward, this is a signal to take profit or prepare for a sell. Similarly, flattening of AMA after a decline suggests a possible upward reversal.
3.3. Combining with other indicators
AMA works excellently together with oscillators and volume indicators:
- AMA + RSI: Buy when price crosses AMA upward and RSI exits the oversold zone (>30). Sell on a downward cross when RSI falls out of the overbought zone (<70).
- AMA + MACD: Use AMA as a trend filter: if price is above AMA, consider only bullish MACD signals; if below, only bearish ones.
3.4. “Double AMA” strategy
Some traders use two AMAs with different periods (e.g., fast AMA(10) and slow AMA(30)). A crossover of the fast AMA above the slow AMA serves as a buy signal, below as a sell signal. This works similarly to a dual‑EMA crossover strategy but with better noise filtering.
4. Adaptive Moving Average parameter settings
Proper parameter selection is critical for effective AMA performance. Let's review the key settings and recommendations.
4.1. Calculation period (n)
Standard values are 10 for short‑term trading and 14–20 for medium‑term. The larger the period, the smoother the AMA, but the slower its reaction to changes.
4.2. Fast and slow constants
These parameters define the boundaries within which the smoothing constant varies. By default fast = 2/(2+1) ≈ 0.666 (equivalent to an EMA with period 2), slow = 2/(30+1) ≈ 0.0645 (equivalent to EMA 30). For more aggressive response, increase slow to 0.1 (EMA 19); for more conservative, reduce to 0.04 (EMA 49).
Trending markets
Increase the period (20–30) and reduce fast/slow for smoother trend following and fewer false exits.
Volatile / sideways markets
Reduce the period (5–10) and increase the gap between fast and slow so that AMA reacts more quickly to short‑term impulses.
4.3. Practical recommendations
- Always test parameters on historical data of the specific instrument.
- For daily stock charts, settings n=14, fast=0.5, slow=0.05 work well.
- For intraday trading on M15‑M30, n=10, fast=0.6, slow=0.08 can be used.
5. Pros and cons of AMA
Pros
- Adapts to volatility — automatically adjusts to the market.
- Reduces false signals — filters noise in sideways markets.
- Fast reaction in trends — does not lag during strong moves.
- Versatility — suitable for any market and timeframe.
Cons
- Lag — like any moving average, AMA follows rather than predicts price.
- Complex setup — requires understanding of parameters and testing.
- Risk of over‑optimization — curve‑fitting may worsen real‑time performance.
Adaptive analysis with AemmTrader
Setting up and tracking Adaptive Moving Average signals across multiple instruments requires time and discipline. The AemmTrader service automatically calculates AMA on all timeframes, detects price‑indicator crossovers and slope changes, and combines AMA signals with oscillator readings and support/resistance levels.
The platform employs ensembles of neural networks to forecast trend direction and dynamically adjusts AMA parameters to the current volatility of each asset. You receive not just a line on the chart, but ready‑to‑use trade ideas with risk levels calculated based on ATR.
With AemmTrader, you focus on strategy while algorithms handle routine analysis. This is your path to more conscious and efficient trading.