TRIX Oscillator: Complete Guide to Triple Exponential Average
TRIX (Triple Exponential Average) is an oscillator developed by Jack Hutson in the 1980s. It filters out market noise using triple exponential smoothing and helps reveal the pure momentum of a trend. In this guide, we will break down the formula, signals, divergences, and trading strategies with TRIX.
1. What is the TRIX Oscillator?
TRIX (Triple Exponential Average) is a technical oscillator created by Jack Hutson and first published in Technical Analysis of Stocks & Commodities magazine. Its primary goal is to filter out insignificant price fluctuations and show the true direction of the trend. TRIX is based on triple smoothing of an exponential moving average, making it significantly less noisy than many other oscillators.
Unlike the RSI or Stochastic, TRIX does not have fixed overbought/oversold levels. Instead, traders analyze its crossovers with the zero line, divergences, and the behavior of a signal line (usually a 9‑period moving average of TRIX itself).
Thanks to triple smoothing, TRIX is well suited for medium‑ and long‑term trading, where reacting to every bit of market noise is undesirable. It pairs well with moving averages and support/resistance levels.
“TRIX is an indicator for the patient. It removes market noise and lets you see the forest for the trees. When TRIX crosses the zero line, it is a truly significant event.”
2. TRIX Calculation Formula
TRIX is based on triple exponential smoothing of the closing price. The calculation is performed in several steps:
2.1. Triple Exponential Moving Average (TEMA)
First, an exponential moving average (EMA) with the chosen period (usually 15 or 14) is calculated. Then an EMA of that EMA is taken, and once more — three consecutive smoothings in total.
EMA2 = EMA(EMA1, N)
EMA3 = EMA(EMA2, N)
2.2. Computing the TRIX Value
TRIX shows the rate of change of the triple exponential average (EMA3) as a percentage:
In other words, TRIX reflects the percentage change of the triple exponential average over one period.
2.3. Signal Line
To generate trading signals, a signal line is often added — a moving average of TRIX (usually with a period of 9):
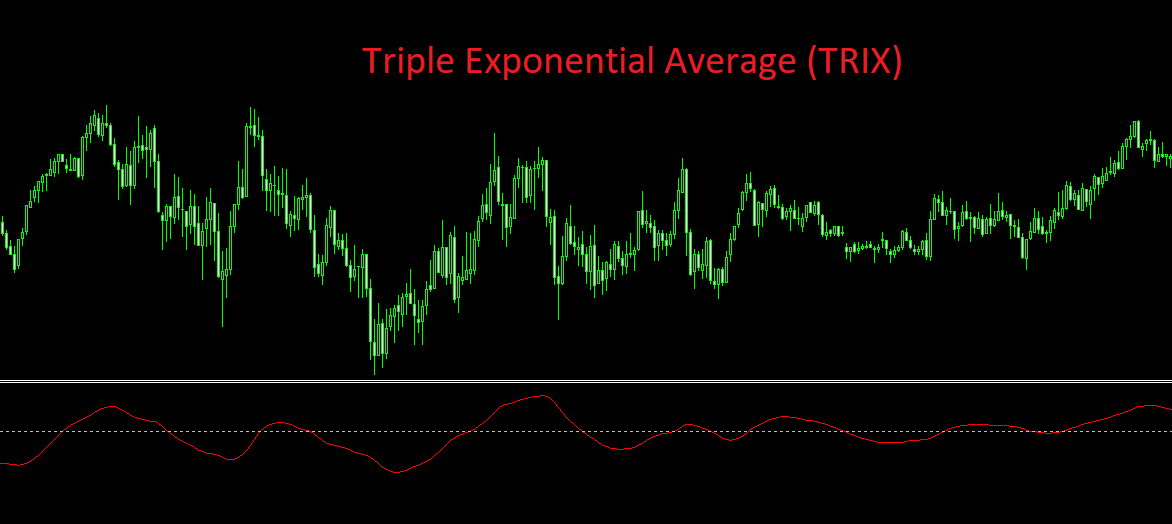
Visualization: TRIX and its signal line below the price chart
3. Interpreting TRIX Signals
3.1. Zero Line Crossover
The primary TRIX signal is the crossing of the zero level. Since TRIX shows the rate of change of the triple moving average:
- Crossing from below to above zero — transition from negative to positive speed. Indicates emerging upward momentum. Buy signal.
- Crossing from above to below zero — transition from positive to negative speed. Indicates emerging downward momentum. Sell signal.
A zero line crossover is a relatively rare but reliable signal, especially on daily and weekly charts.
3.2. Signal Line Crossovers
As with MACD, the crossover of the fast TRIX line and the slow signal line generates more frequent signals:
- TRIX crosses the signal line from below to above — bullish signal.
- TRIX crosses the signal line from above to below — bearish signal.
The reliability of these signals increases when they align with the direction of the global trend (e.g., determined by the position of price relative to the EMA 200).
4. TRIX Divergences: A Powerful Leading Signal
Thanks to smoothing, divergences on TRIX are considered more reliable than on many other oscillators because they are less likely to be caused by market noise.
Bullish Divergence
Situation: Price makes a lower low, but TRIX forms a higher low.
Meaning: Bearish momentum is fading despite the price decline. An upward reversal is expected.
Action: Prepare to buy; enter after confirmation (e.g., TRIX crossing above zero).
Bearish Divergence
Situation: Price makes a higher high, but TRIX forms a lower high.
Meaning: Bullish momentum is weakening. A downward reversal is expected.
Action: Prepare to sell; enter after confirmation (e.g., TRIX crossing below zero).
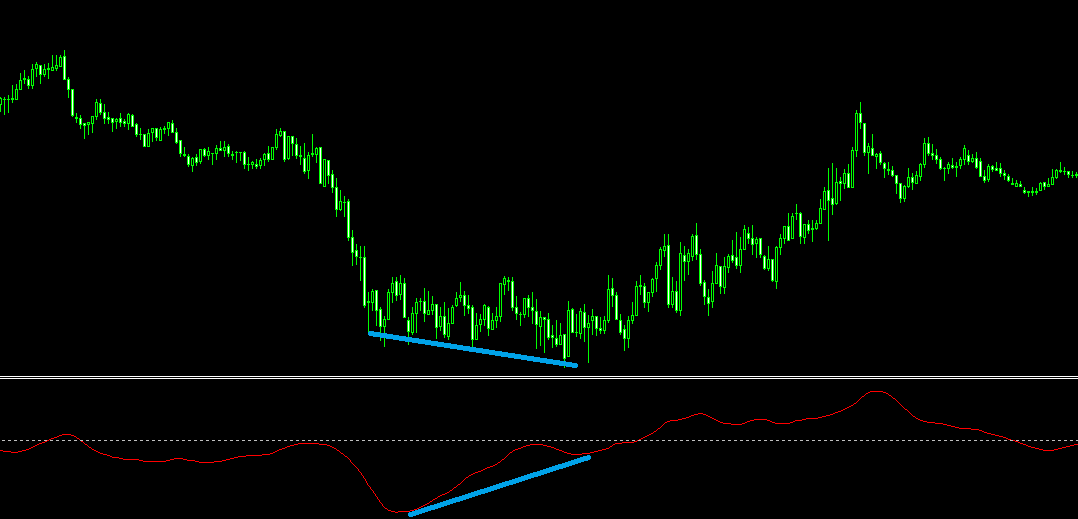
Example of bullish divergence: price falls, TRIX rises
5. Practical Trading Strategies with TRIX
5.1. "Clean Trend" Strategy on Daily Charts
On the daily timeframe, TRIX with a period of 15 (standard) provides quality signals on zero line crossovers. Strategy:
- Wait for the daily close on which TRIX crosses above the zero line.
- Enter a buy position on the open of the next day. Place a stop‑loss beyond the nearest local low or use a dynamic ATR‑based stop.
- Hold the position until TRIX crosses below the zero line (exit signal).
5.2. TRIX + Moving Averages: Double Filter
Adding a 200‑period exponential moving average (EMA 200) helps filter out false signals:
- Price above EMA 200 — consider only bullish TRIX signals (zero line crossover upward or bullish divergences).
- Price below EMA 200 — consider only bearish TRIX signals.
5.3. TRIX and RSI Combination
Combining two oscillators — smoothed TRIX and faster RSI — helps find high‑probability entry points. For example, if TRIX gives a bullish zero line crossover and RSI simultaneously exits the oversold zone (above 30), it is a strong buy signal.
“TRIX is an indicator for those tired of false signals. It may miss the very beginning of a move, but it rarely gets the direction wrong.”
6. Pros and Cons of TRIX
Pros
- Minimal noise — triple smoothing removes insignificant fluctuations.
- Clear signals — zero line crossovers and divergences are easy to interpret.
- Versatility — suitable for stocks, forex, cryptocurrencies.
- Leading nature — divergences warn of a reversal in advance.
Cons
- Lag — due to triple smoothing, signals arrive later than with fast oscillators.
- Less effective on lower timeframes — many false crossovers on M1‑M15.
- No fixed zones — requires getting used to interpretation.
TRIX Under Algorithmic Control: Less Noise, More Meaning
The main advantage of TRIX — signal purity — is also its drawback: zero line crossovers are rare, and a trader must wait patiently while monitoring many instruments. The AemmTrader service solves this problem. Its algorithms scan charts around the clock, capturing every TRIX zero line crossover and generating signals in real time.
Instead of staring at charts waiting for a rare but important signal, you receive a ready‑made trade idea with risk assessment. This is not just automation — it is extracting maximum benefit from a "slow" indicator.