Bulls Power in Trading: Complete Guide to the Bull Power Oscillator
Bulls Power is an oscillator developed by Alexander Elder to measure buying pressure in the market. In this guide we will cover the calculation formula, signal interpretation, practical strategies, and combining with other indicators to improve trading efficiency.
1. Basic concepts: what is Bulls Power?
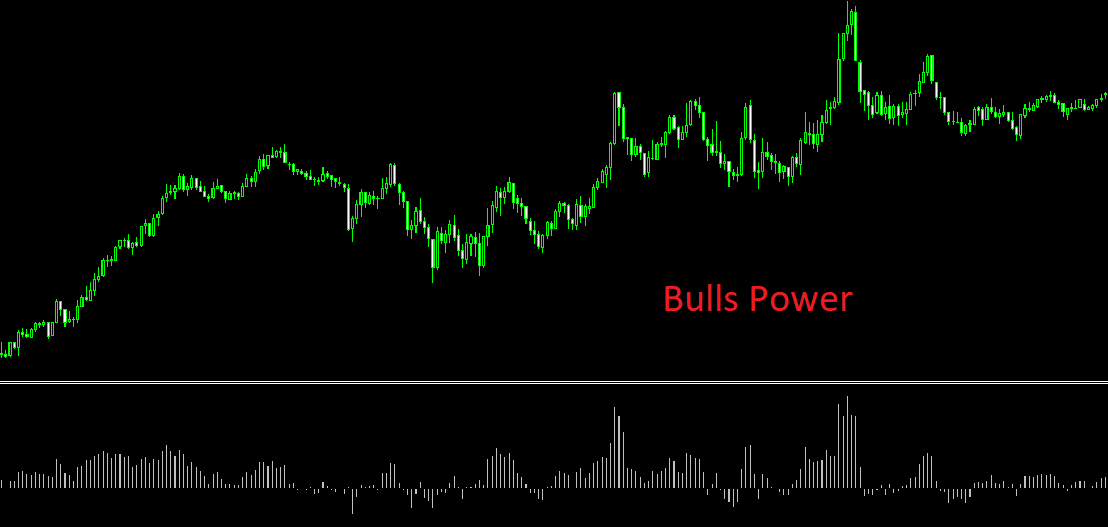
Bulls Power is an oscillator that is part of the Elder's Force Index. It was developed by renowned trader and psychologist Alexander Elder, author of the bestseller “Trading for a Living”. Bulls Power measures the ability of bulls (buyers) to push price up. Unlike trend indicators that show direction, Bulls Power focuses on the strength of buying pressure and helps identify when that pressure is strengthening or weakening.
Bulls Power is often used together with its paired indicator Bear Power, which measures the strength of sellers. Together they give a complete picture of market sentiment. The indicator is especially useful for detecting divergences, finding reversal points, and assessing overbought/oversold conditions.
«Bulls push price up, bears pull it down. Bulls Power shows how successful bulls are at the moment. When their strength runs out, the market prepares for a reversal.»
2. Principle and calculation formula
Bulls Power is calculated using a simple but effective formula:
where:
- High — the highest price of the current bar (candle);
- EMA(13) — exponential moving average with period 13, which serves as the “balance line” between bulls and bears.
The idea is that the 13-period EMA reflects the average price over recent time. If the current candle's high is above this average, bulls are pushing price up — Bulls Power is positive. If the high is below the EMA, bulls are weak — the indicator is negative. The further the value from zero, the stronger the buying pressure (positive values) or the weaker the bulls (negative values).
Important: Bulls Power is not a standalone buy or sell signal. It must be used in the context of the trend and combined with other tools. For example, in an uptrend, positive Bulls Power values confirm bull strength, while negative values indicate temporary weakening and a possible entry point.
3. Interpreting Bulls Power values
Proper understanding of Bulls Power signals is key to its effective use. Let us consider the main states of the indicator.
3.1. Positive values (bullish pressure)
A positive Bulls Power indicates that the current candle's high is above the 13-period EMA. This is normal for an uptrend. However, it is important to track the dynamics: if positive values become higher, bulls are gaining strength. If positive values begin to decline (become less positive), this may signal weakening buying pressure and a possible downward reversal.
3.2. Negative values (weakening bulls)
Negative Bulls Power occurs when the high is below EMA(13). In a downtrend this is normal. In an uptrend, the appearance of negative values may be an early sign of a trend change. The lower the negative value, the weaker the bulls.
3.3. Extreme values and divergences
Like any oscillator, Bulls Power can reach extreme levels. In a strong uptrend, the indicator can rise to +50, +100 or higher (depending on asset volatility). Such extremes often precede a correction or reversal. A particularly strong signal is a bearish divergence: price makes a new high, while Bulls Power makes a lower high. This indicates weakening bullish strength and often foreshadows a fall. Similarly, a bullish divergence (price makes a new low, while Bulls Power makes a higher low) signals an upcoming reversal up.
4. Trading strategies with Bulls Power
Bulls Power can be used as a standalone filter, but best results are achieved when combined with trend indicators. Here are three proven strategies.
4.1. Buying on bull strengthening
Conditions: Identify an uptrend (e.g., price above EMA(13) or above 200-period MA). Wait for Bulls Power to move into positive territory after a negative phase and cross the zero line from below. Entry point: when it crosses the zero line from below. Stop-loss: below the last local low. Target: previous high or 2-3 ATR.
4.2. Selling on bull weakening
Conditions: Uptrend begins to fade. Bulls Power reaches extremely high values (e.g., +50 and above), then turns down and crosses the zero line from above. Entry point: when it crosses the zero line from above. Stop-loss: above the last local high. Target: previous low or 2-3 ATR. This strategy is suitable for experienced traders as it requires precise identification of overbought conditions.
4.3. Divergences on Bulls Power
Bearish divergence: price makes a new high, while Bulls Power makes a lower high. Sell signal. Bullish divergence: price makes a new low, while Bulls Power makes a higher low. Buy signal. Divergences on Bulls Power are especially effective on higher timeframes (H4, D1, W1).
«Divergence between price and oscillator is like a warning from the market itself. Bulls Power says: “Bulls are running out of steam, get ready for a reversal”.»
5. Combining Bulls Power with other indicators
Bulls Power is rarely used alone. Here are the most effective combinations.
5.1. Bulls Power + Bear Power (Elder's Force Index)
Bear Power = Low − EMA(13). Together with Bulls Power they show who dominates the market. When both indicators are positive, bulls control the market. Both negative — bears control. A divergence between them indicates a possible reversal.
5.2. Bulls Power + moving averages
Use a long-term MA (e.g., 200) to determine the trend, and Bulls Power to find entry points. In an uptrend (price above 200 MA), buy when Bulls Power becomes positive and rising. In a downtrend, sell when Bulls Power falls below zero after a positive phase.
5.3. Bulls Power + RSI
RSI helps confirm overbought/oversold conditions. For example, if RSI is above 70 (overbought) and Bulls Power reaches extremely high values — sell signal. If RSI is below 30 (oversold) and Bulls Power starts rising from negative values — buy signal.
6. Limitations and drawbacks of Bulls Power
Like any indicator, Bulls Power is not perfect. Its main drawbacks:
- Lag. EMA(13) introduces delay, so signals may come late.
- False signals in sideways markets. In a flat market, Bulls Power often gives frequent zero‑line crossings, leading to losing trades.
- Dependence on period choice. The standard period of 13 does not suit all assets and timeframes. For cryptocurrencies sometimes period 21 works better, for stocks — 9.
- Does not show trend direction. Bulls Power only measures bull strength, not where price is going. Therefore it must be combined with trend indicators.
To minimise false signals, always check the higher timeframe and use filters (e.g., volume or ADX).
Practical tips for using Bulls Power
- Adjust the EMA period to your style. For scalping use 5-8, for swing trading 13-21, for long-term 34-50.
- Use Bulls Power on multiple timeframes. A signal on H1 confirmed on H4 or D1 is much more reliable.
- Watch volume. If Bulls Power rises and volume increases, the signal is strong.
- Do not ignore divergences. This is one of the strongest oscillator signals.
How technology enhances Bulls Power analysis
Manual analysis of Bulls Power on many charts takes time and attention. Services like AemmTrader automatically calculate Bulls Power and Bear Power on all timeframes, and also look for divergences and reversal patterns. The platform provides ready‑made signals with success probability, which is especially useful for beginner traders.
The neural network analyses the indicator's history and predicts moments when bullish strength weakens. This allows entering trades at early stages of a reversal, when manual analysis does not yet give a clear signal. Combining Bulls Power with machine learning gives you an objective assessment of the market situation.
Using such tools, you can focus on strategy rather than tedious calculations. This is the bridge between amateur and professional approaches — saving time and increasing efficiency.