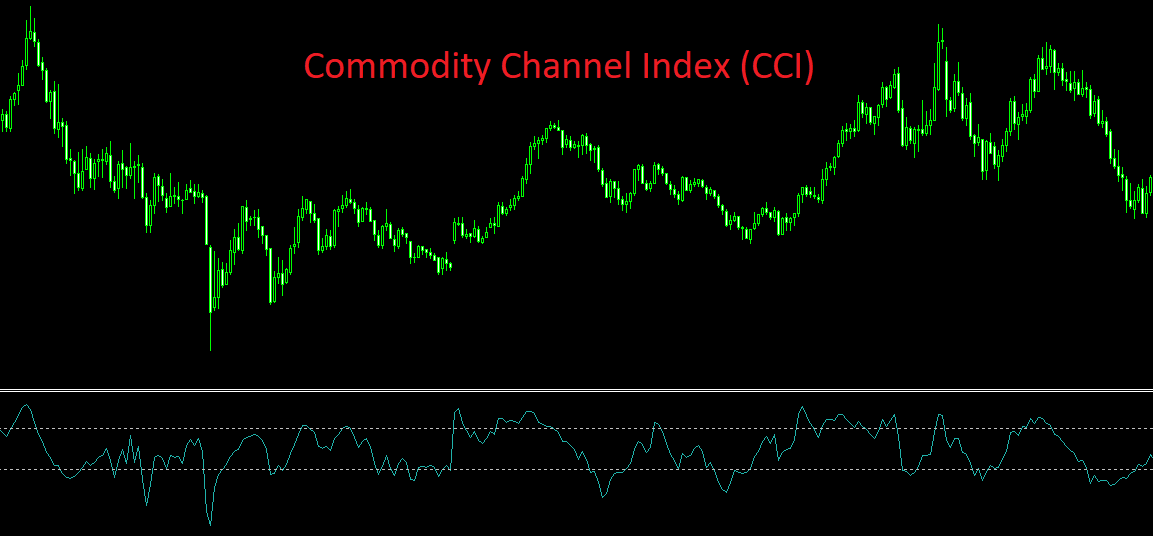
Commodity Channel Index (CCI): Complete Guide to the Oscillator
The Commodity Channel Index (CCI) is a powerful oscillator developed by Donald Lambert to measure the deviation of price from its average value. In this guide we will cover the calculation formula, signal interpretation, trading strategies, and combining with other indicators.
1. What is the Commodity Channel Index (CCI)?
The Commodity Channel Index (CCI) is an oscillator developed by Donald Lambert in the 1980s for analyzing commodity markets. Later it began to be used on any financial market: stocks, currencies, indices, cryptocurrencies. The main task of the CCI is to measure the deviation of the current price from its statistical average. Unlike many oscillators (RSI, Stochastic), CCI is not limited to the 0–100 range; its values can theoretically be anything, making it a flexible tool for identifying extreme market conditions.
The core idea of CCI: if the price has deviated significantly from the average level, it may indicate overbought (too high) or oversold (too low) conditions, after which a correction or reversal is likely. The indicator is also effective for finding divergences.
«CCI was created for commodity markets, but its versatility has allowed it to be used wherever there are cyclical price fluctuations. The key is to choose the right period.»
2. CCI Calculation Formula
CCI is calculated in several steps. First, the Typical Price is calculated for each period, then its simple moving average, and then the mean deviation. The formula is:
where:
- Typical Price (TP) = (High + Low + Close) / 3 — typical price of the current period;
- SMA(TP, N) — simple moving average of the typical price over N periods (standard N = 20);
- Mean Deviation — mean absolute deviation of the typical price from its SMA over the same N periods;
- 0.015 — constant chosen by Lambert so that about 70–80% of CCI values fall within the -100 to +100 range.
The constant 0.015 makes interpretation convenient: the +100 and -100 levels serve as natural overbought/oversold boundaries. However, traders can adjust this coefficient or use other thresholds (e.g., +200/-200 for stronger signals).
3. Interpreting CCI Values
The classic interpretation of CCI is based on the +100 and -100 levels:
- CCI > +100 — overbought zone. Price is significantly above average, a correction or downward reversal is possible.
- CCI < -100 — oversold zone. Price is significantly below average, a correction or upward reversal is possible.
- CCI between -100 and +100 — normal range, market not in extreme.
However, these levels are not rigid rules. In a strong trend, CCI can stay above +100 (in an uptrend) or below -100 (in a downtrend) for a long time. Therefore, reversal signals should be confirmed by other methods (divergences, candlestick analysis, levels).
Some traders use +200/-200 levels for extreme overbought/oversold conditions, and +50/-50 for earlier signals. The choice depends on the volatility of the asset and the timeframe.
4. Advantages and Disadvantages of CCI
✅ Advantages
- Versatility — works on any market (stocks, forex, cryptocurrencies, commodities).
- Flexibility — no fixed range allows adapting levels to any asset.
- Identifying extremes — helps find overbought/oversold zones.
- Ease of interpretation — values above +100 / below -100 are easy to track.
- Effectiveness on divergences — discrepancies with price give strong reversal signals.
❌ Disadvantages
- Lag — like any oscillator, CCI gives signals with a delay.
- False signals in a flat market — frequent crossings of +100/-100 levels in sideways markets.
- Does not show trend direction — requires combination with trend indicators.
- Sensitivity to period choice — the standard period of 20 is not suitable for all timeframes.
To minimize drawbacks, experienced traders use CCI in combination with moving averages, support/resistance levels, and volume filters.
5. Trading Strategies with CCI
Let us consider several proven strategies.
5.1. Strategy on crossing +100 / -100 levels
Buy: when CCI crosses the -100 level from below to above (exit from oversold zone). Sell: when CCI crosses the +100 level from above to below (exit from overbought zone). Entry is made on the close of the candle that confirms the crossover. Stop-loss: beyond the nearest local extreme. Target: previous support/resistance level or 2-3 ATR. Important: in a strong trend, CCI can stay above +100 or below -100 for a long time, so the exit‑from‑zone signal may be premature. It is recommended to use a trend filter (e.g., price above 200 EMA for buys, below for sells).
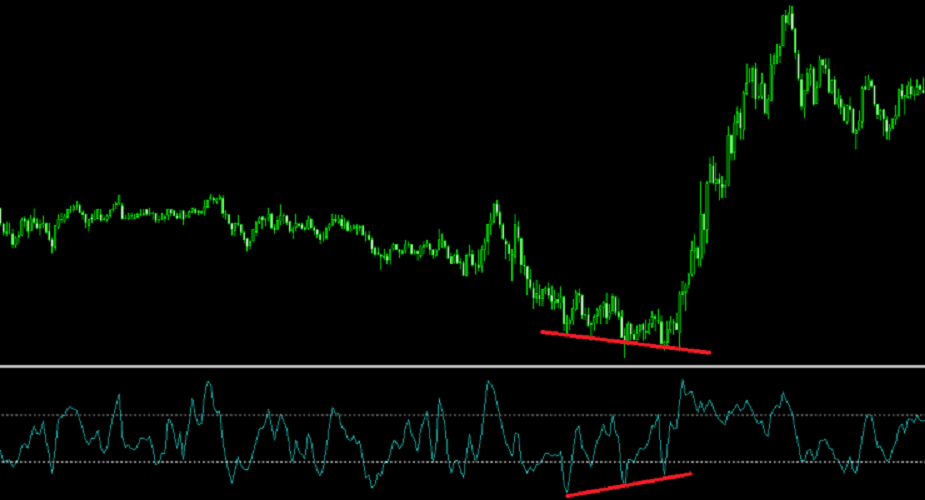
5.2. Divergence strategy
Divergence between price and CCI is one of the most reliable reversal signals. Bullish divergence: price makes a new low, while CCI makes a higher low. Buy signal. Bearish divergence: price makes a new high, while CCI makes a lower high. Sell signal. Entry is made after CCI turns from the second extreme. Stop‑loss beyond the price extreme. Target — previous level or 1-2 ATR. Divergences on CCI are especially strong on higher timeframes (H4, D1).
5.3. Combining CCI with moving averages
Determine the long‑term trend using EMA 200. In an uptrend (price above EMA 200), use only buy signals from CCI (exit from -100 or bullish divergence). In a downtrend (price below EMA 200), use only sell signals. This filters out false signals against the main trend.
5.4. Channel breakout strategy (CCI > +200 or CCI < -200)
Extreme CCI values (e.g., above +200 or below -200) often precede a sharp move. However, entering against the trend is dangerous. It is better to wait for CCI to return below +200 (for a sell) or above -200 (for a buy) and then open a position in the direction of the trend. This strategy is suitable for experienced traders.
«CCI works best in conjunction with trend indicators. By itself it produces a lot of noise, but combined with EMA 200 it becomes a powerful filter.»
6. Divergences on CCI: How to Find and Use Them
Divergences are discrepancies between the direction of price movement and the direction of the oscillator. CCI is particularly sensitive to divergences, and they often precede strong reversals.
- Classic bullish divergence: price forms two consecutive lows, the second low lower than the first, while CCI forms two lows, the second low higher than the first. This indicates weakening bearish pressure. Buy signal.
- Classic bearish divergence: price forms two consecutive highs (the second higher than the first), while CCI forms two highs (the second lower than the first). Weakening bullish pressure — sell signal.
- Hidden divergence: used for trend continuation. Bullish hidden divergence — price makes a higher low, while CCI makes a lower low (signal to continue growth). Bearish hidden divergence — price makes a lower high, while CCI makes a higher high (signal to continue decline).
Practical Tips for Using CCI
- Choose the period according to your timeframe. For intraday trading (M5, M15) use period 9-14, for daily charts — 20, for weekly — 30-50.
- Do not use CCI in isolation. Always combine with trend indicators (moving averages, ADX) and levels.
- Backtest your strategies. Before applying CCI in real trading, test its effectiveness on historical data.
- Watch the news. Before important events, CCI may give false signals due to increased volatility.
- Use CCI to confirm breakouts. If price breaks an important level and CCI confirms the move (e.g., exits the oversold zone on a breakout up), the signal is stronger.
How Technology Enhances CCI Analysis
Manual search for divergences and overbought/oversold levels on CCI takes a lot of time. Modern services like AemmTrader automatically calculate CCI on all timeframes, mark divergences and issue signals when crossing the +100/-100 levels. The platform also integrates CCI into multi‑indicator strategies, e.g., combining with RSI and Stochastic to filter false signals.
Using such tools, you can focus on strategy rather than tedious calculations. This is the bridge between amateur and professional approaches — saving time and increasing efficiency.