Continuation Patterns in Trading: Triangles, Flags, Pennants and Wedges
Continuation patterns are consolidation figures that occur within a stable trend and with high probability end with price moving in the same direction as before. In this guide we will cover all types of triangles, flags, pennants and wedges, learn to identify them correctly and use them in trading.
1. Triangles
Triangles are among the most reliable continuation patterns. They form when the price range gradually narrows while trading volume declines. There are three main types: Symmetrical Triangle, Ascending Triangle and Descending Triangle. All signal a temporary balance between buyers and sellers, after which a breakout usually occurs in the direction of the prevailing trend.
1.1. Symmetrical Triangle
A symmetrical triangle forms when the support line slopes upward and the resistance line slopes downward. Inside the figure, price makes successively lower highs and higher lows. This pattern typically appears in the middle of a trend and does not give a clear indication of breakout direction – it can occur either up or down. However, within a strong trend, the breakout most often follows the main direction. Key rule: the longer the consolidation, the stronger the subsequent impulse. A breakout is confirmed when a candle closes beyond the triangle boundary and volume spikes.
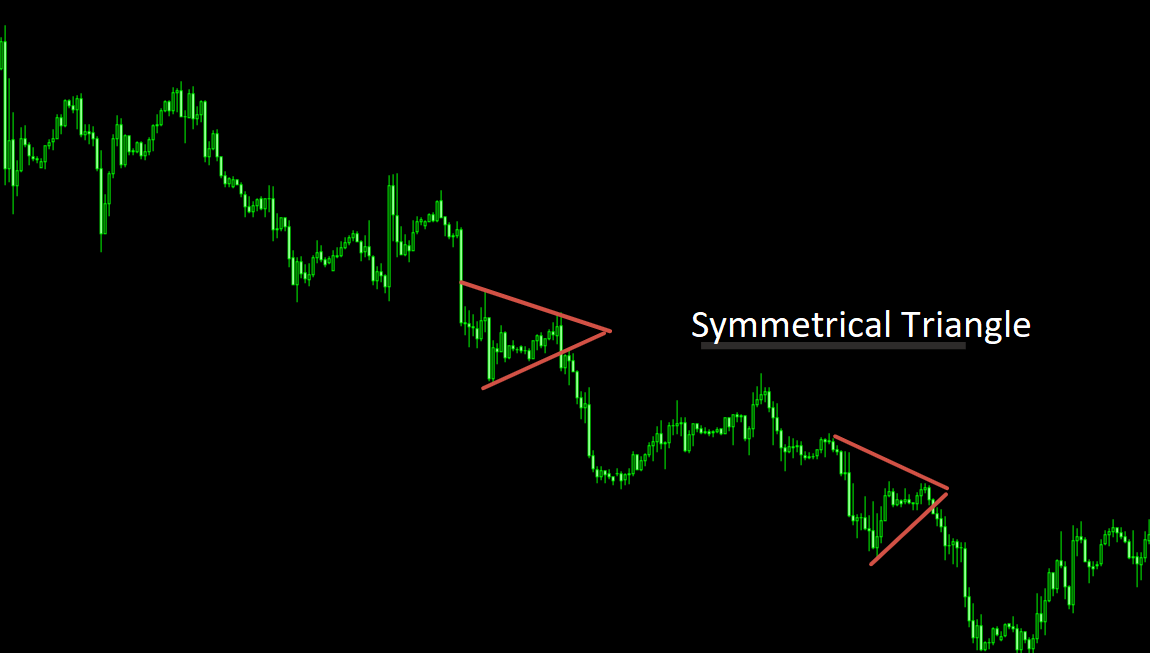
The chart above shows a classic symmetrical triangle. Notice how price touches both lines several times before breaking the upper boundary. Volume typically declines during the formation and rises sharply on the breakout – an important confirmation.
1.2. Ascending Triangle
An ascending triangle has a horizontal upper line (resistance) and an upward‑sloping lower line (support). This configuration indicates that buyers are raising the bounce level each time, while sellers cannot push price below the same resistance. The ascending triangle almost always breaks upward and is considered a strong bullish signal. It is most common in rising markets.
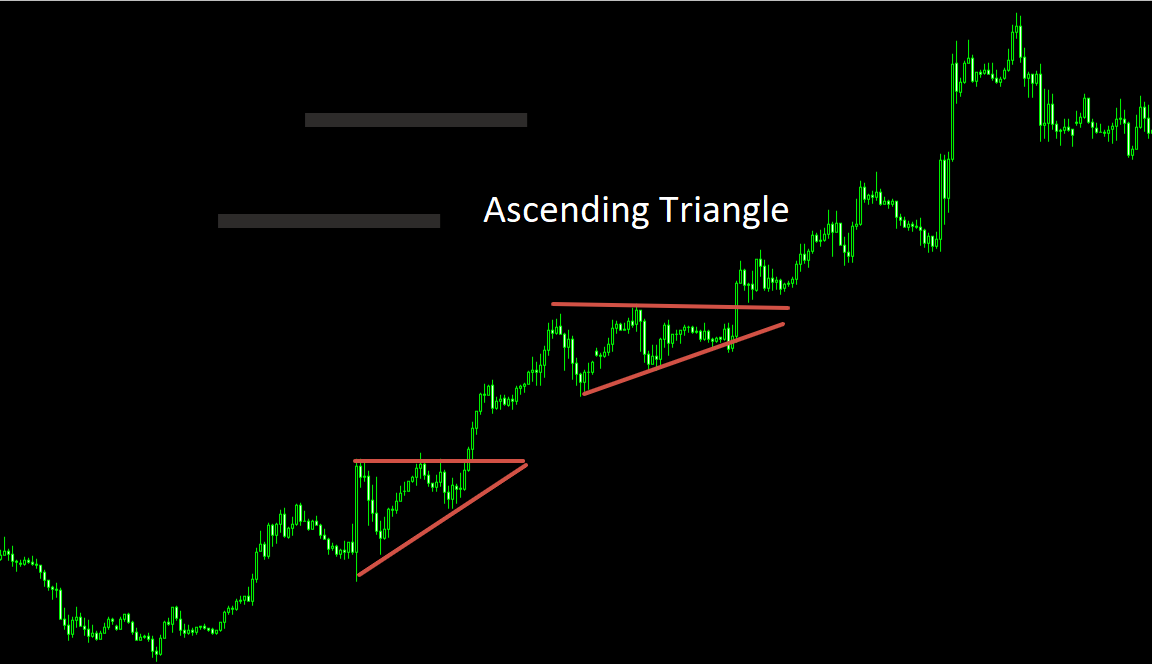
The entry point is when a candle closes above the horizontal resistance. A stop‑loss is usually placed just below the last swing low inside the figure. The price target is often equal to the height of the widest part of the triangle, measured from the breakout point.
1.3. Descending Triangle
A descending triangle is the mirror image of an ascending triangle. Its lower line is horizontal (support) and the upper line slopes downward (resistance). This shows that sellers push price lower each time, while buyers cannot break above the same low. The descending triangle usually breaks downward and is a bearish signal. It is typical for falling trends.
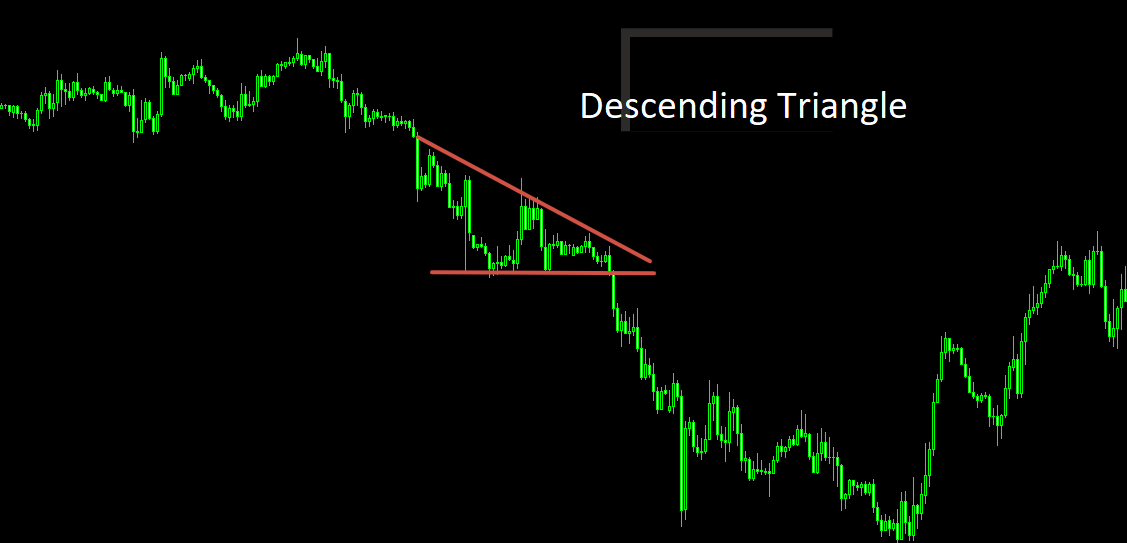
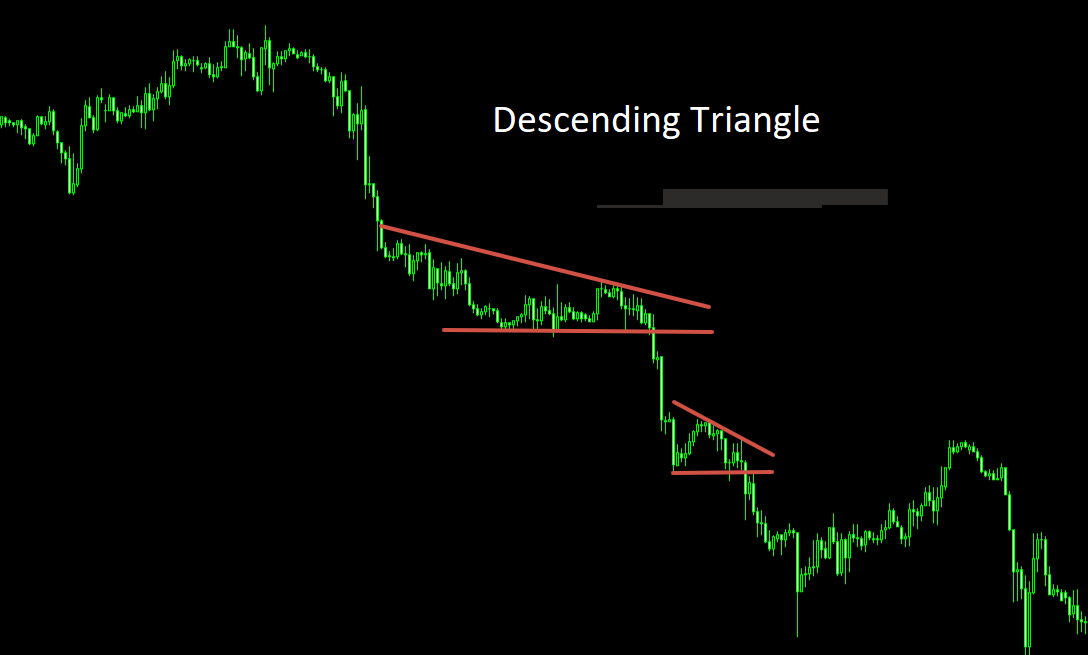
A break below support is confirmed by high volume. The stop‑loss is placed just above the last swing high inside the triangle. The target is calculated similarly – using the height of the base of the figure.
«Triangles are a battle between bulls and bears. The longer the fight, the stronger the winner. But never enter before the breakout – wait for confirmation.»
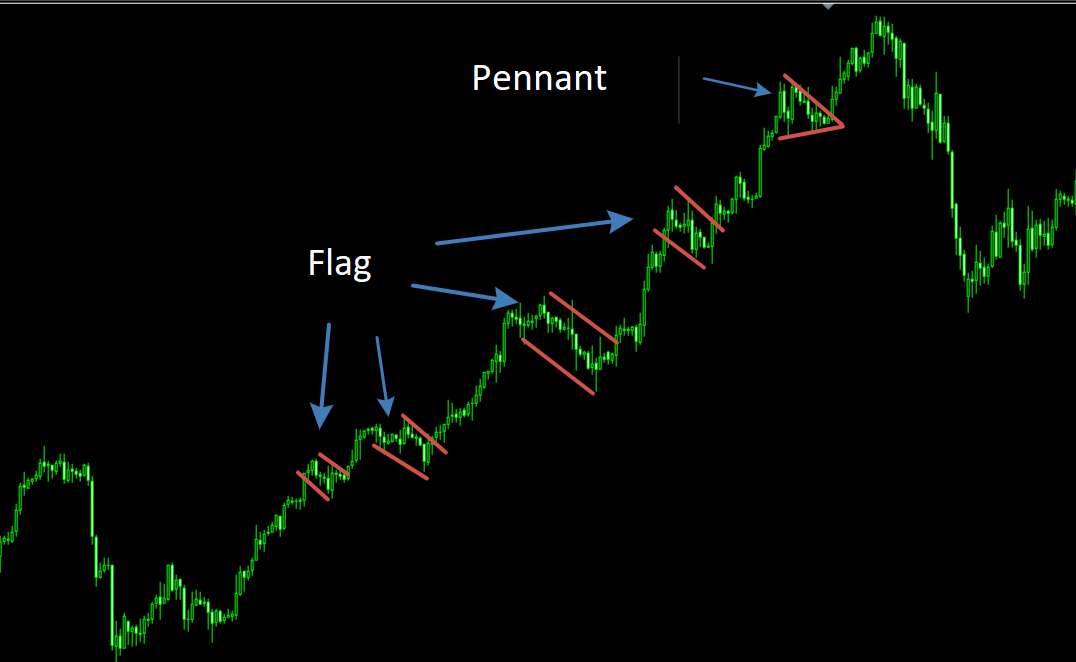
2. Flags & Pennants
Flags and Pennants are short‑term continuation patterns that appear after a sharp price move (the “flagpole”). They represent a brief consolidation before the trend resumes. Both patterns usually form within 1‑4 weeks, much faster than triangles.
2.1. Flag
A flag looks like a parallelogram tilted against the main trend. For example, in a strong uptrend the flag will tilt slightly downward, and in a downtrend it tilts upward. The boundaries of a flag are two parallel lines (support and resistance). Volume typically falls during the flag and rises sharply on the breakout.
2.2. Pennant
A pennant resembles a small symmetrical triangle, but unlike ordinary triangles, it forms very quickly, often within 1‑2 weeks. Its lines converge, and the breakout occurs in the direction of the main trend. A pennant is considered a slightly stronger signal than a flag because of the more pronounced narrowing of the range.
How to trade flags and pennants: after a breakout above the upper boundary (in an uptrend), open a long position. Place a stop‑loss just below the lower boundary of the pattern. The target is usually equal to the length of the flagpole (the preceding sharp move), measured from the breakout point. Important: if the breakout occurs in the opposite direction (e.g., price breaks down from a bullish flag), it may signal a reversal.
A common beginner mistake: trying to enter before the breakout, hoping for a bounce off the boundary. Statistics show it is better to wait for a candle close beyond the figure – this increases signal reliability many times over.
3. Wedges
A wedge is a pattern similar to a pennant, but both of its boundaries slope in the same direction (rising wedge or falling wedge). Unlike a triangle, the wedge lines do not meet at a single point – they both go up or down, but with different slopes. A wedge can be either a continuation or a reversal pattern, depending on the context.
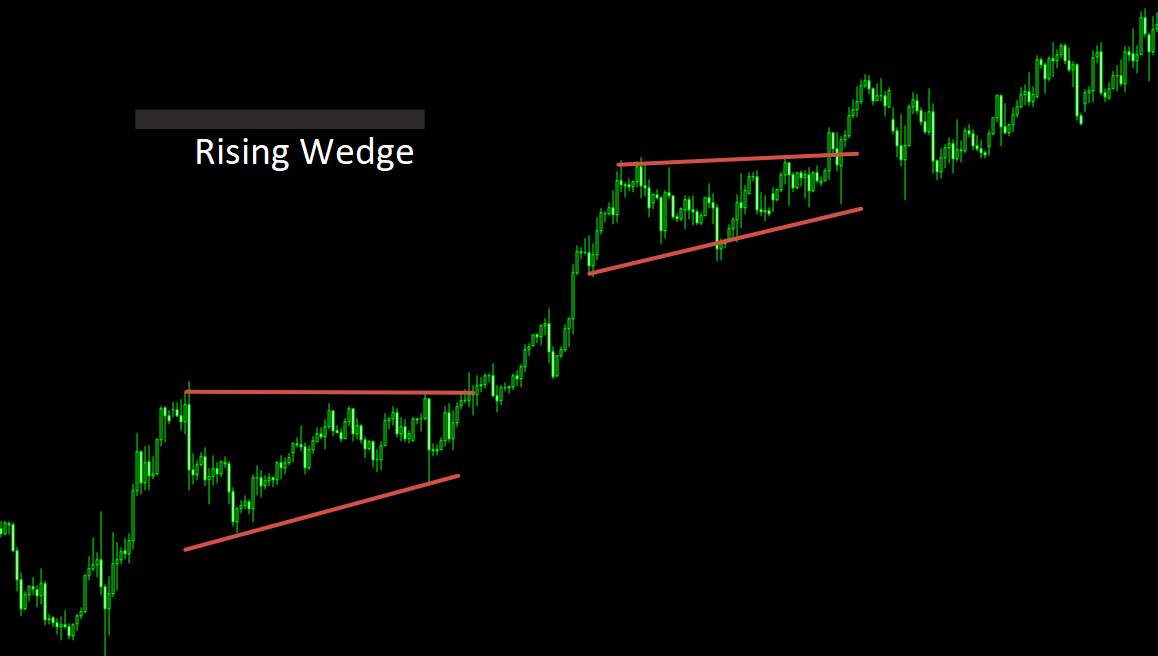
3.1. Rising Wedge
A rising wedge forms when both support and resistance slope upward, with the support line having a steeper angle. In an uptrend, a rising wedge is most often a continuation pattern: after it completes, price resumes rising. However, at the top of a long uptrend, a rising wedge can signal a reversal. Therefore, always assess the higher‑timeframe trend.
3.2. Falling Wedge
A falling wedge is the mirror image: both boundaries slope downward, with the resistance line being steeper. In a falling market, it acts as a continuation pattern (price breaks the lower boundary and falls further). But at the bottom of a trend, a falling wedge can become a reversal pattern. A classic example is the “falling wedge” before a strong rally.
The key difference between a wedge and a flag: in a wedge both boundaries are sloped, while in a flag they are parallel. Additionally, a wedge takes longer to form (several weeks or months) and may precede a more significant move.
To increase signal reliability, it is recommended to use additional indicators: RSI (to assess overbought/oversold conditions) and volume. For example, an upward breakout of a rising wedge should be accompanied by rising volume; if volume is low, the signal may be false and should be ignored.
«A wedge is a pattern of uncertainty. Only volume and subsequent price action can confirm whether it was just a pause in the trend or its end.»
Practical tips for trading continuation patterns
- Always determine the higher‑timeframe trend. Continuation patterns work more reliably when they align with the dominant trend (e.g., an ascending triangle in a bull market).
- Wait for breakout confirmation. False breakouts are a common trap. A signal is confirmed when a candle closes beyond the figure and trading volume increases.
- Use a stop‑loss. For triangles, place the stop beyond the opposite side of the pattern; for flags and pennants, just below/above the narrowest part.
- Set a target based on pattern height. For triangles and wedges, measure the widest part and project it from the breakout point. For flags, use the flagpole length.
- Combine with other tools. Moving averages, support/resistance levels and oscillators increase entry accuracy.
How technology extends the power of technical analysis
Manual pattern hunting across dozens of charts and timeframes takes hours and requires intense focus. Modern services like AemmTrader offer a built‑in Pattern Analyzer – automatic recognition of classic chart patterns on all timeframes. AI draws the boundaries on the chart and determines whether the figure is a continuation or reversal pattern.
The system recognises more than 15 patterns: Head and Shoulders, Double Bottom, Double Top, Triangles (symmetrical, ascending, descending), Wedges, Flags, Pennants and others. You only need to assess the breakout probability provided by the neural network and make your trading decision.
Using such tools, you can find patterns faster, backtest hypotheses and make decisions based on objective data rather than intuition. This is the bridge between amateur and professional approaches – saving time and increasing efficiency.