Japanese Candlesticks in Trading: Signals and Patterns for Profitable Trading
Japanese candlesticks are not just a way to display price, but a powerful tool for reading market psychology. Each candle tells a story of the battle between bulls and bears. In this article, we will break down 9 key candlestick signals that will help you spot trend reversals early and find high‑potential entry points.
📊 Why Japanese Candlesticks Are a Must‑Have for Traders
Japanese candlestick charts are universal: they are used in Forex, cryptocurrencies, stock, and commodity markets. Unlike line charts, candlesticks show four key prices per period (open, close, high, low) and are colored based on who won—buyers or sellers.
Candlestick analysis helps identify reversal patterns at early stages, and modern services like AemmTrader use neural networks to automatically recognize these patterns, saving traders time.
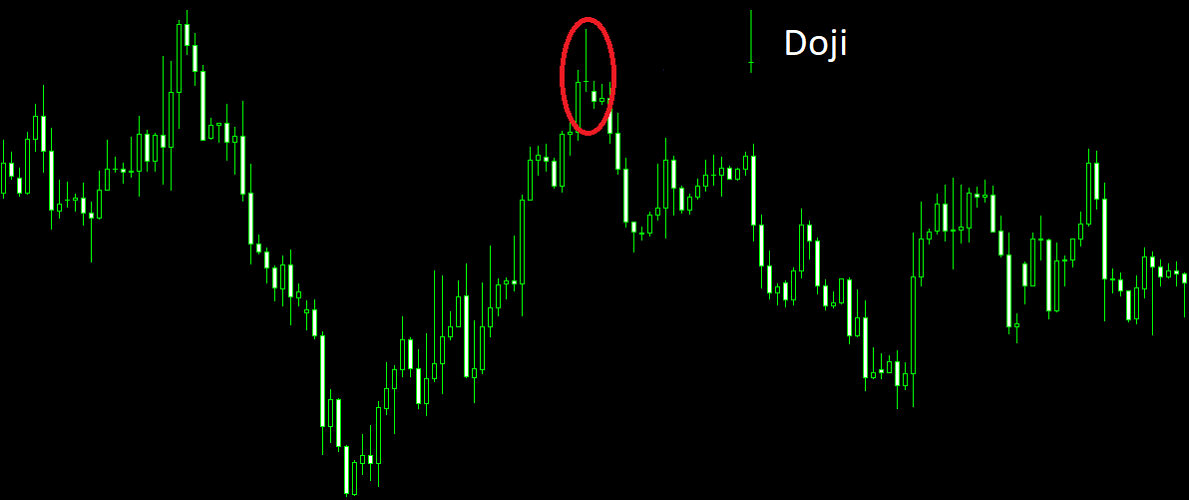
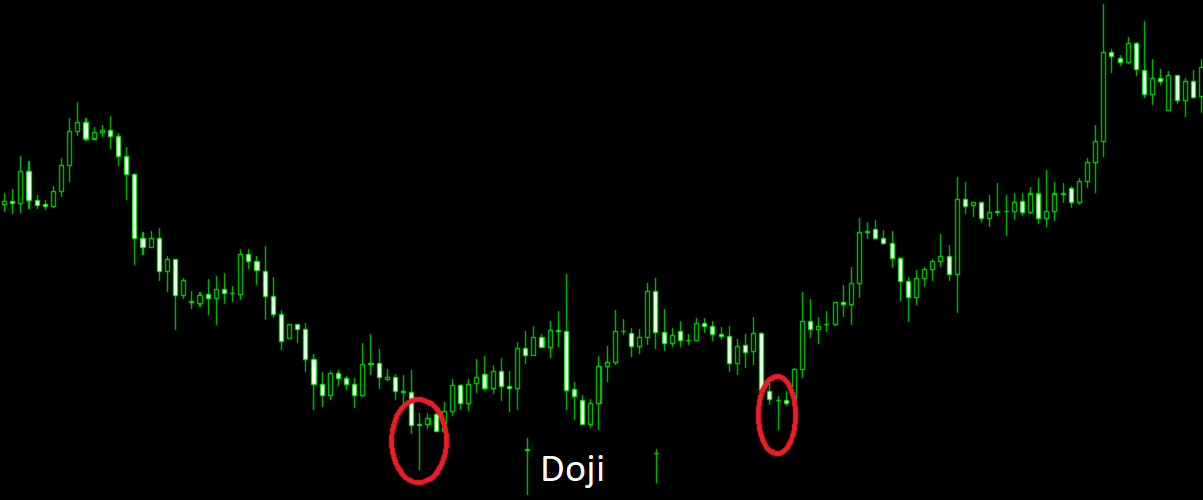
① Doji — Balance of Power
Doji is a candle where the open and close prices are virtually identical, resulting in no real body or a very small one. It signals market indecision: neither bulls nor bears can gain the upper hand.
In a sideways market, doji is neutral. But if it appears after a strong uptrend, it's a warning sign—buyers are losing control, and a downside reversal is possible. After a downtrend, doji may foreshadow a shift in favor of bulls. As Japanese traders say, "the doji shows the market is bidding farewell to its trend."
Pay special attention to doji forming at new highs or lows—this strengthens the signal.
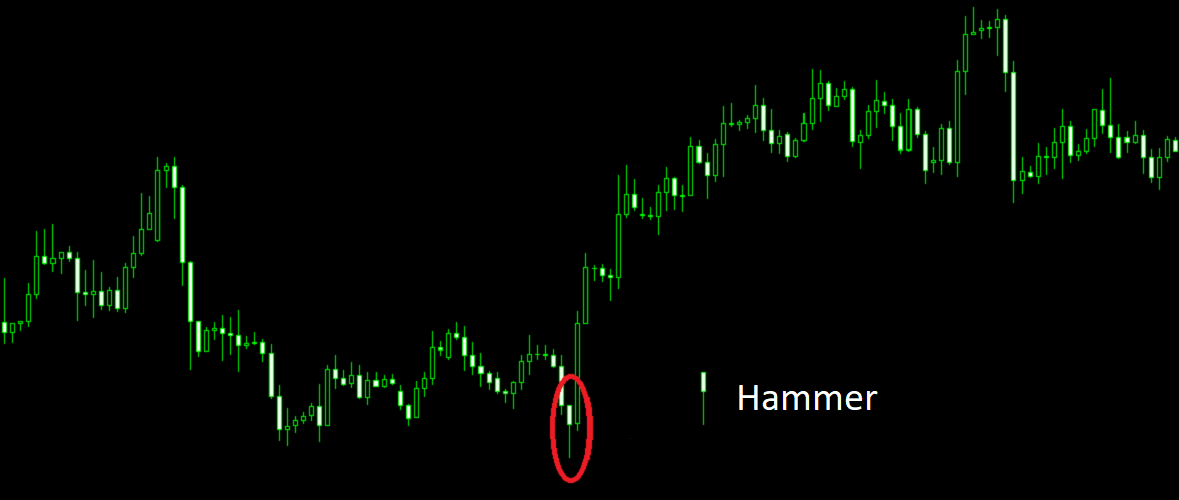
② Hammer — Bullish Reversal
Hammer is a candle with a long lower shadow (at least twice the body length) and a small body near the top of the range. The upper shadow is very short or absent. This shape resembles a hammer striking an anvil and bouncing back.
The hammer forms during a downtrend and signals that bears tried to push the price lower but met strong resistance from bulls, who drove the price back to the open. This is a powerful bullish signal. The longer the lower shadow and the smaller the body, the more reliable the pattern. After a hammer appears, the market often retests its low, forming a support zone.
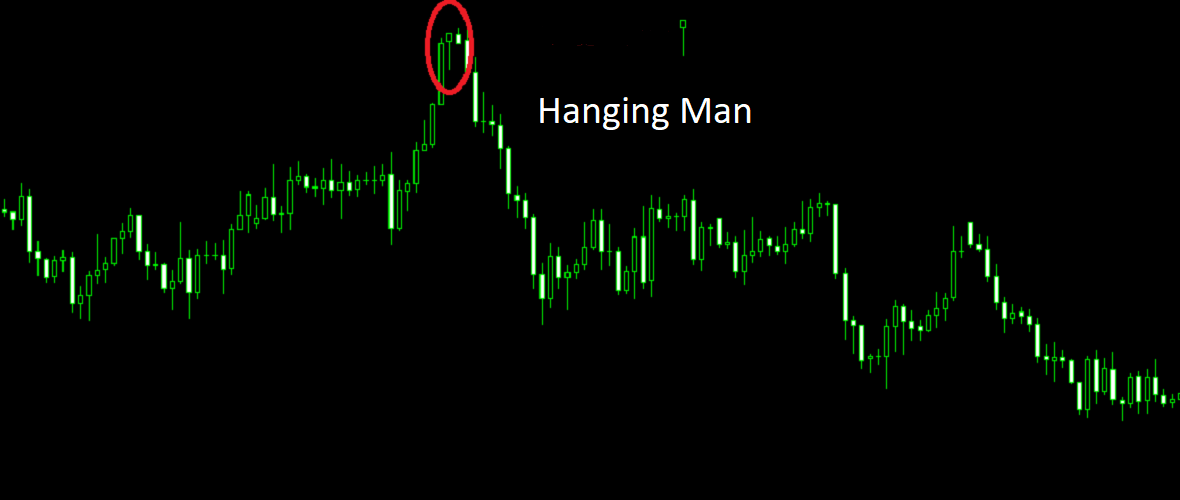
③ Hanging Man — Bearish Harbinger
Hanging Man has the same shape as a hammer but appears after an uptrend. Its name reflects the essence: the market is "hanging by a thread," and a drop may be imminent. The long lower shadow shows that bears began aggressive selling, and although bulls managed to recover part of the price by the close, control is no longer as strong.
To confirm the hanging man signal, wait for the next candle to close below the hanging man's body. This provides confidence that a reversal is truly underway.
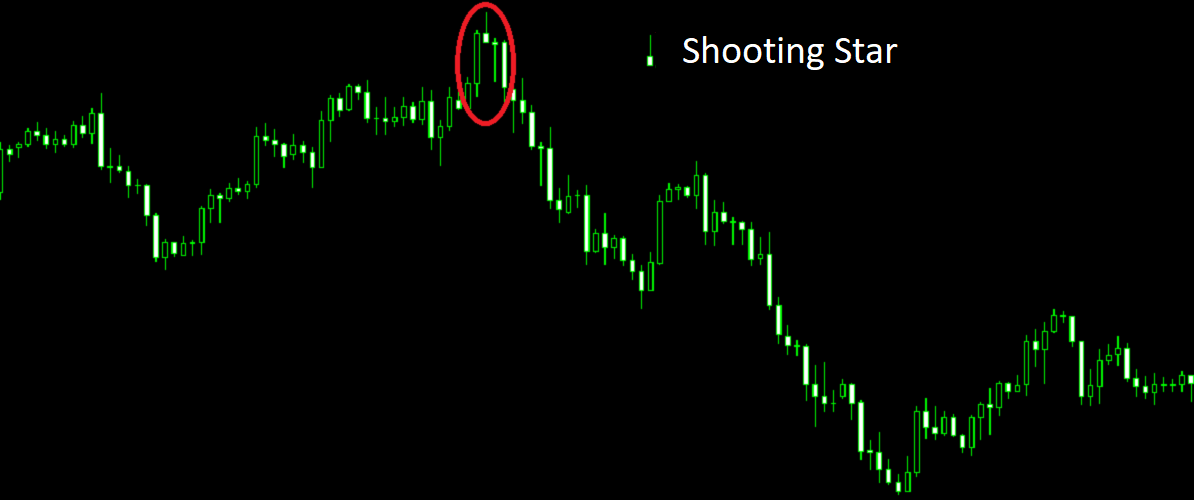
④ Shooting Star — Bearish Reversal
Shooting Star is the mirror image of a hammer: a long upper shadow and a small body near the bottom of the candle. It occurs after an uptrend and shows that buyers tried to push the price higher but met strong resistance from sellers, who drove the price back down.
An ideal shooting star has a gap up from the previous candle, but even without it, the signal remains significant. The longer the upper shadow, the stronger the bearish sentiment.
⑤ Engulfing — Change of Power
The engulfing pattern consists of two candles and is one of the most reliable reversal signals.
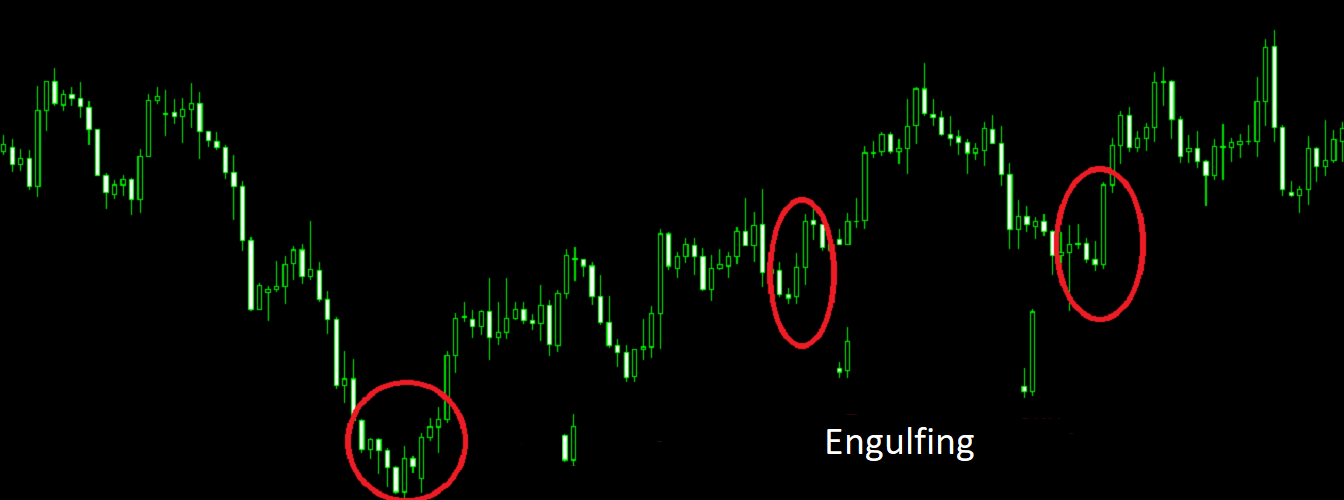
Bullish Engulfing
Appears in a downtrend. The first candle is bearish (black/red), the second is bullish (white/green), and its body completely engulfs the body of the first candle. This signals that buyers have seized the initiative.
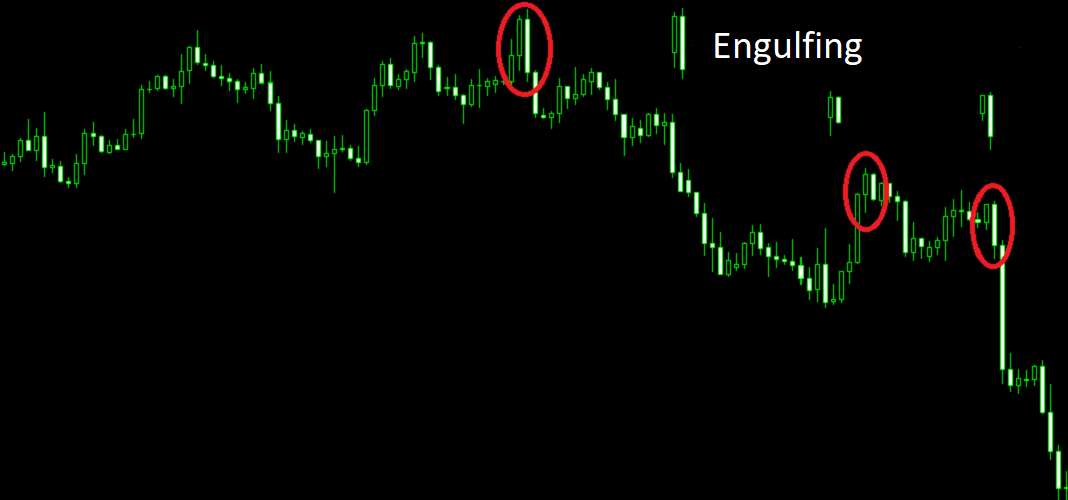
Bearish Engulfing
Appears in an uptrend. The first candle is bullish, the second is bearish, and its body completely engulfs the body of the first. Sellers take over, and the trend is ready to reverse downward.
The larger the second body relative to the first, the stronger the signal. Shadows are not considered—only the engulfing of bodies matters.
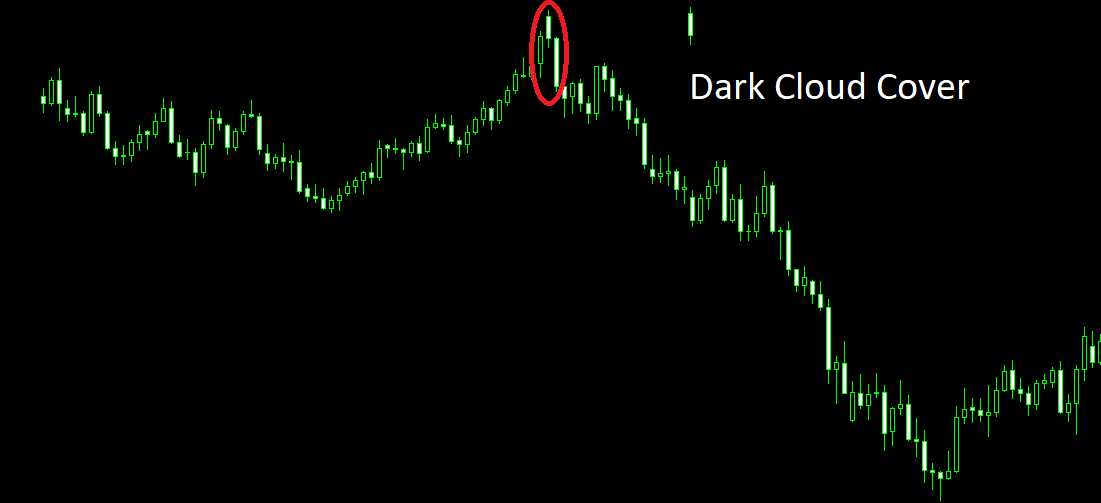
⑥ Dark Cloud Cover — Bearish Reversal
Dark Cloud Cover is a two‑candle bearish pattern. The first candle is a long white (bullish) one, and the second opens with a gap up (above the first candle's high) but closes deep inside the body of the first candle (preferably below its midpoint). This shows that morning buyer optimism was crushed by aggressive sellers by the session's end.
The deeper the second candle penetrates the first candle's body, the more reliable the signal. If the close is above the midpoint of the first candle, it's better to wait for additional confirmation in the next session.
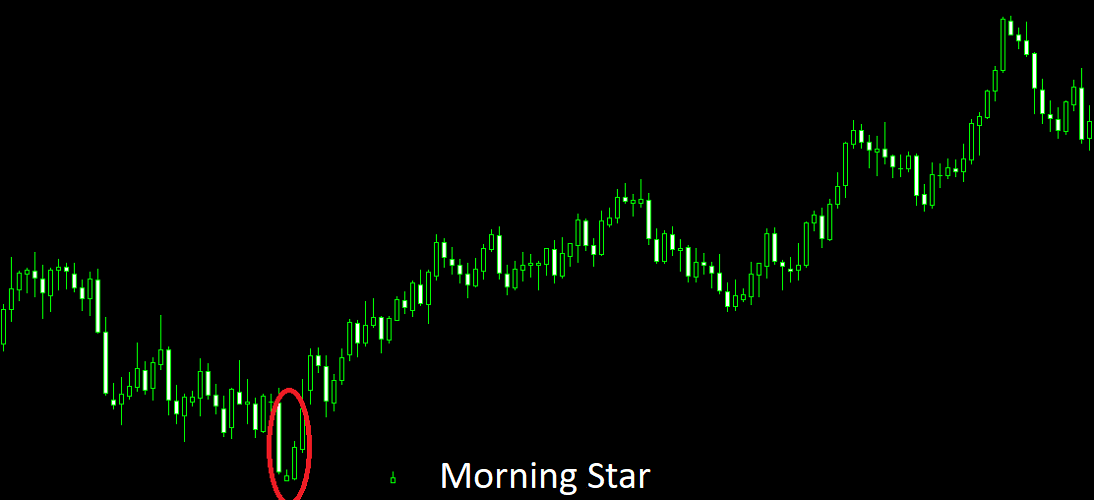
⑦ Morning Star — Bullish Reversal
Morning Star is a three‑candle bullish pattern, named after the planet Mercury, which heralds the sunrise. It consists of:
- A long black candle (downtrend).
- A small candle (white or black) with a gap down—the "star," showing indecision.
- A long white candle that closes deep inside the body of the first black candle.
An ideal morning star has gaps before and after the "star," but even without the second gap, the pattern remains a strong bullish signal. After forming, the low area becomes a support zone.
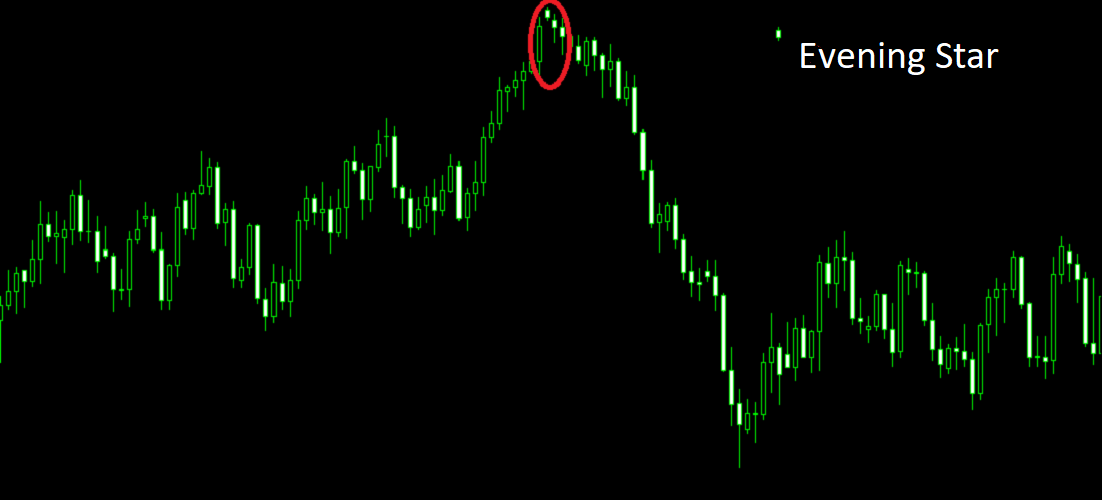
⑧ Evening Star — Bearish Reversal
Evening Star is the mirror‑image bearish counterpart of the morning star. Named after the planet Venus, which appears before darkness falls. It consists of:
- A long white candle (uptrend).
- A small candle with a gap up (the "star").
- A long black candle that closes deep inside the body of the first white candle.
This is a powerful signal that bulls have exhausted their strength and the market is ready to fall. The high area of the evening star often becomes a resistance level.
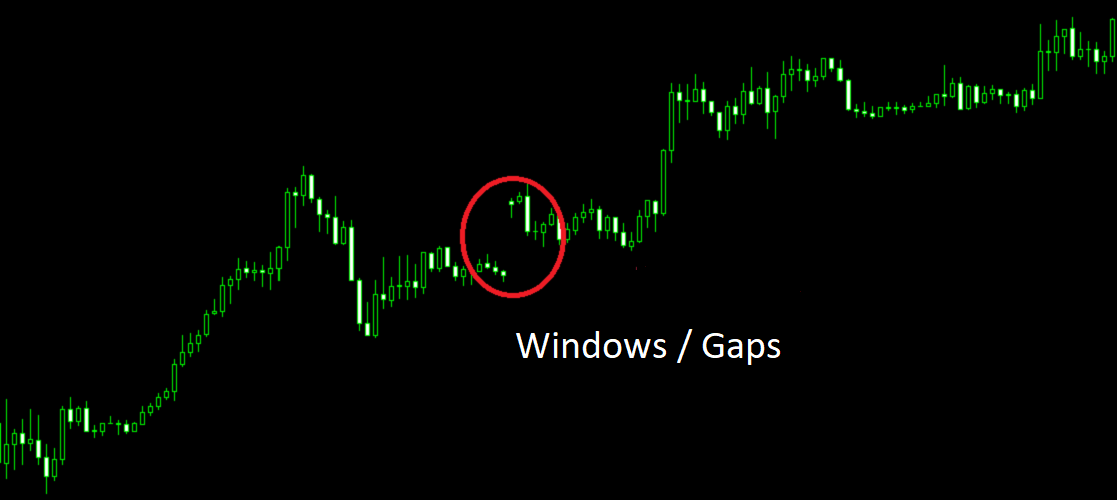
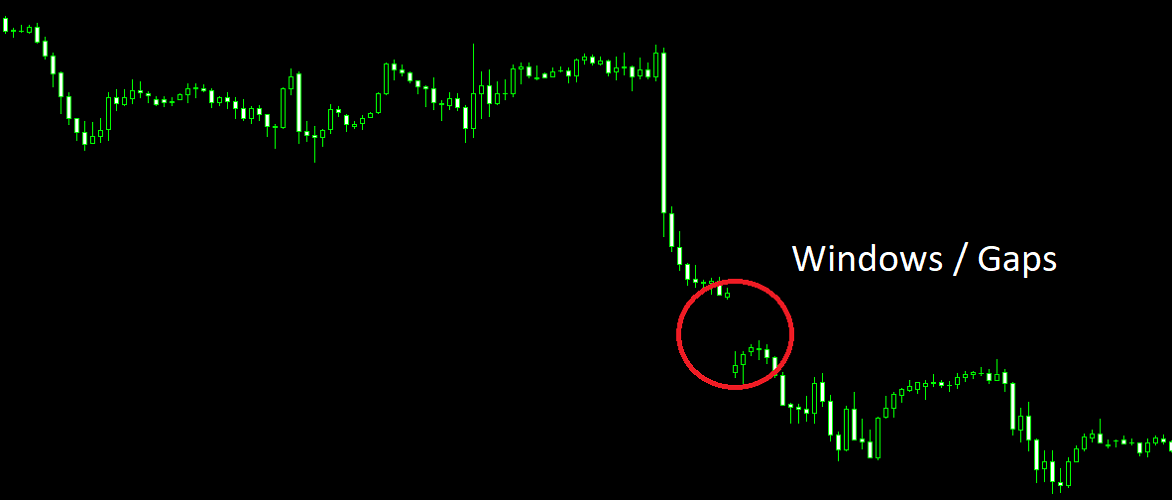
⑨ Windows (Gaps) — Continuation Patterns
Window (gap) on a candlestick chart occurs when there is a price gap between the shadows of adjacent candles. There are two types:
- Rising Window — the low of the current candle is higher than the high of the previous candle. This is a bullish continuation pattern: after it, the uptrend usually resumes.
- Falling Window — the high of the current candle is lower than the low of the previous candle. This is a bearish continuation signal for a downtrend.
Windows show moments of unanimous market sentiment and serve as important support or resistance levels in the future.
Father of Candlestick Analysis in the West
"Japanese candlesticks are not just a way to display prices; they are a window into market psychology. They show who is in control: bulls or bears."
🤖 How Technology Enhances Candlestick Analysis
Memorizing and promptly recognizing all candlestick patterns on a chart is a task that requires experience and attention. Modern services like AemmTrader use XGBoost neural networks and Monte Carlo simulations to automatically detect candlestick patterns and assess price movement probabilities. This allows traders to find promising setups faster and make data‑driven decisions rather than emotional ones.
Use technology to enhance your trading, but remember that understanding the logic of candlesticks remains the foundation of successful trading.