Trend Reversal Patterns: V‑Tops, Double/Triple Tops/Bottoms, Head and Shoulders
Reversal patterns are chart formations that signal a potential change in the direction of price movement. They occur after a prolonged trend and help traders lock in profits or open positions in a new direction. In this guide we will cover all major reversal patterns: from simple V‑tops to the complex Head and Shoulders formation.
1. V‑Tops & V‑Bottoms
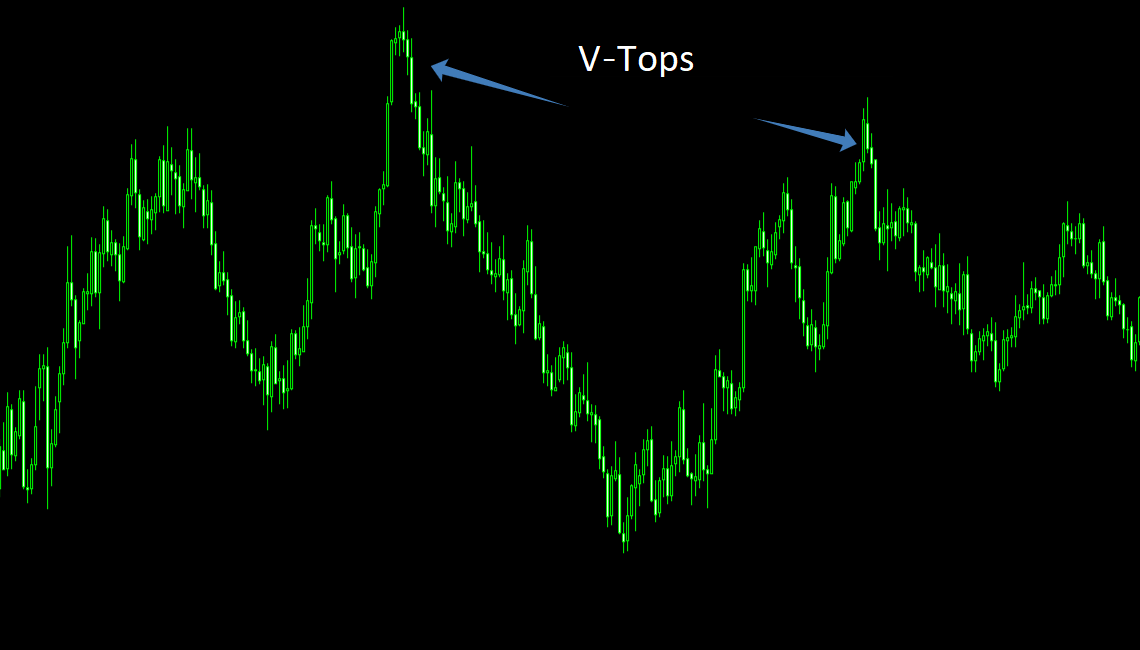
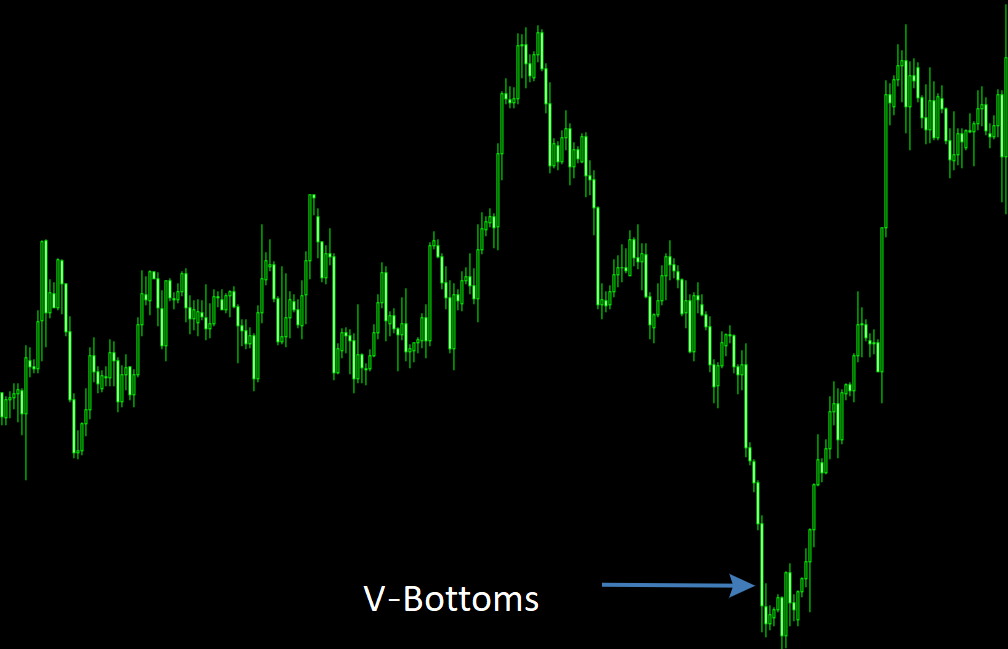
V‑tops and V‑bottoms are sharp, symmetrical reversals that occur without a prolonged consolidation phase. Such patterns often indicate panic buying or selling and are usually accompanied by extreme volume. The main challenge in identifying a V‑shape is distinguishing it from a regular correction within a trend. Additional signals can help: a clear spike, a reversal day with a wide range, a large gap, or a sudden change in volume.
V‑tops form when after a long, rapid rise prices suddenly collapse with the same speed. V‑bottoms are the mirror image: after a prolonged decline, prices reverse and rise just as quickly. On commodity markets, where leverage and sharp changes in supply/demand are common, V‑bottoms occur more often than on stock markets. Nevertheless, such patterns should be seen as a signal that prices have deviated too far and too fast. Both buyers and sellers need time to reassess the situation. Therefore, a V‑bottom is often followed by a sideways period or a pullback.
Trading V‑shaped reversals is difficult due to the lack of clear confirmation levels. Some traders use entry on a retest after the first impulse or combine V‑shapes with oscillators (e.g., RSI divergence). A conservative approach is to wait for a sideways range to form after the V‑move and enter only on a breakout of its boundary.
2. Double & Triple Tops/Bottoms
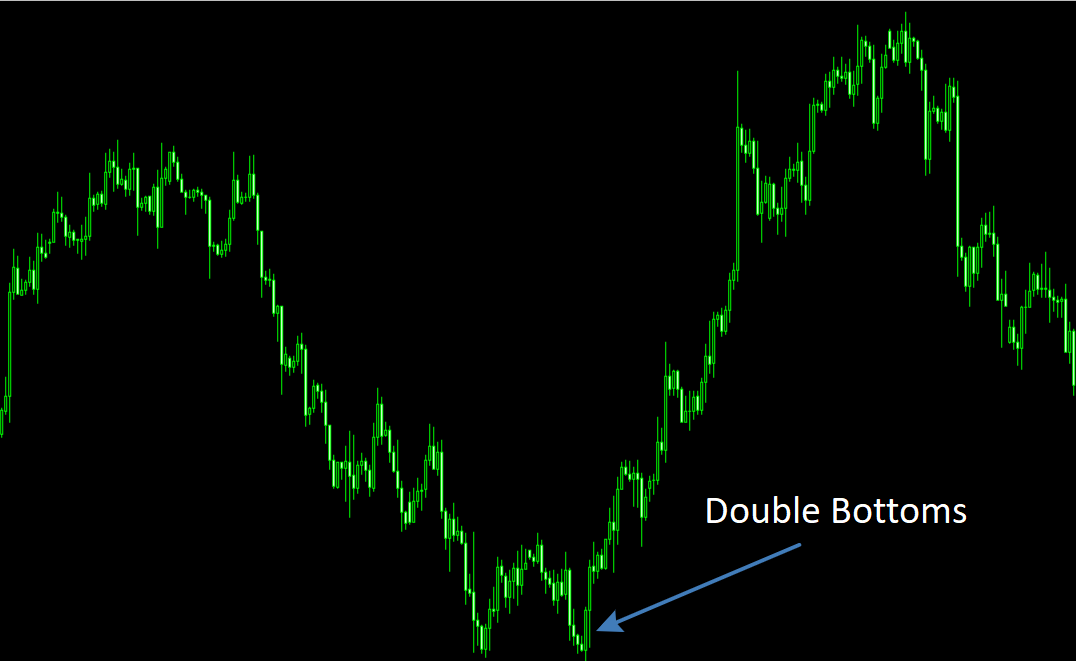
Double tops and double bottoms are among the most recognisable reversal patterns. They form when price twice reaches approximately the same level (resistance for tops, support for bottoms) and fails to break through. The pattern is considered complete when after the second peak price falls below the intermediate low between the two tops (for a double top) or after the second trough rises above the intermediate high (for a double bottom).
Triple tops and triple bottoms occur less frequently, especially triple tops. They consist of three touches of the same level. Triple bottoms are more common in commodity markets and periods of low volatility, when investors gradually accumulate positions at attractive prices. Like double patterns, triple figures require confirmation by a breakout of the neckline (the line drawn through the intermediate extremes).
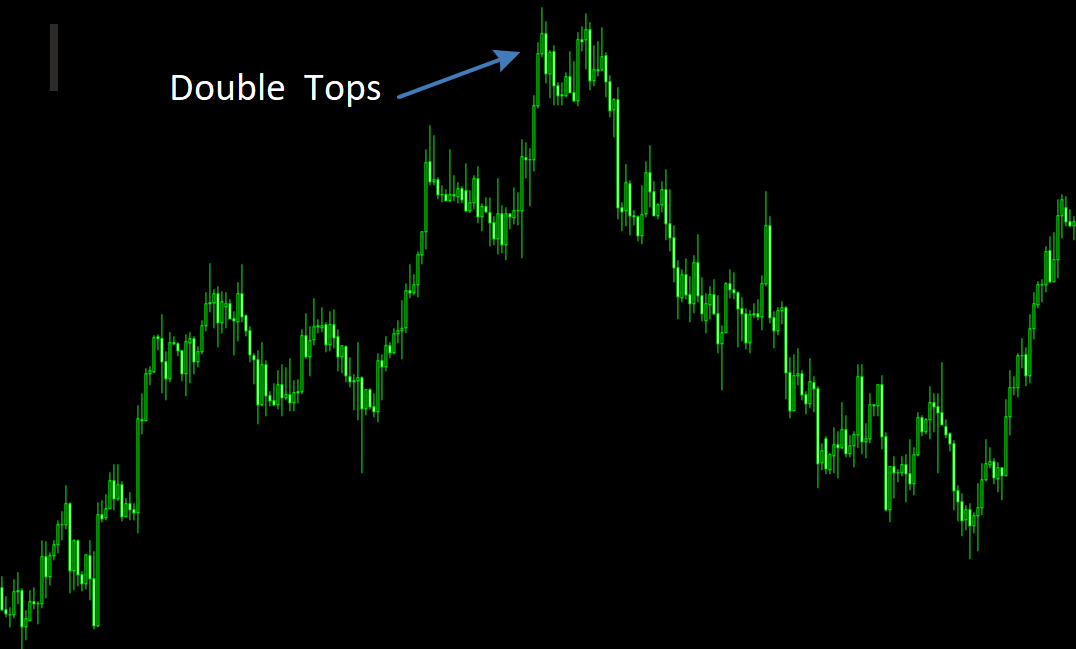
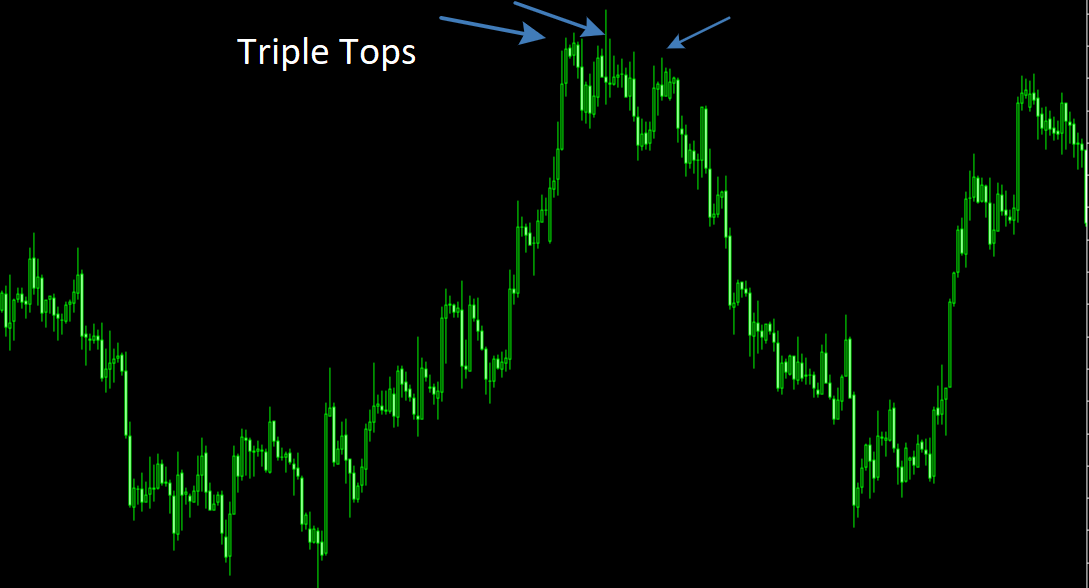
Risks of trading double and triple tops. Many novice traders see double tops where none exist. In a strong bull market, potential double tops constantly “disappear” – price makes new highs and moves higher. Therefore, it is crucial to use additional filters: decreasing volume on the second peak, divergences on oscillators, support/resistance levels on higher timeframes. It is best to wait for official confirmation – a neckline break. Although some profit may be missed, signal reliability increases significantly.
«A double top without volume confirmation is only potential, not real. Never enter before the neckline break unless you are prepared for frequent false signals.»
3. Extended Rectangular Bottom
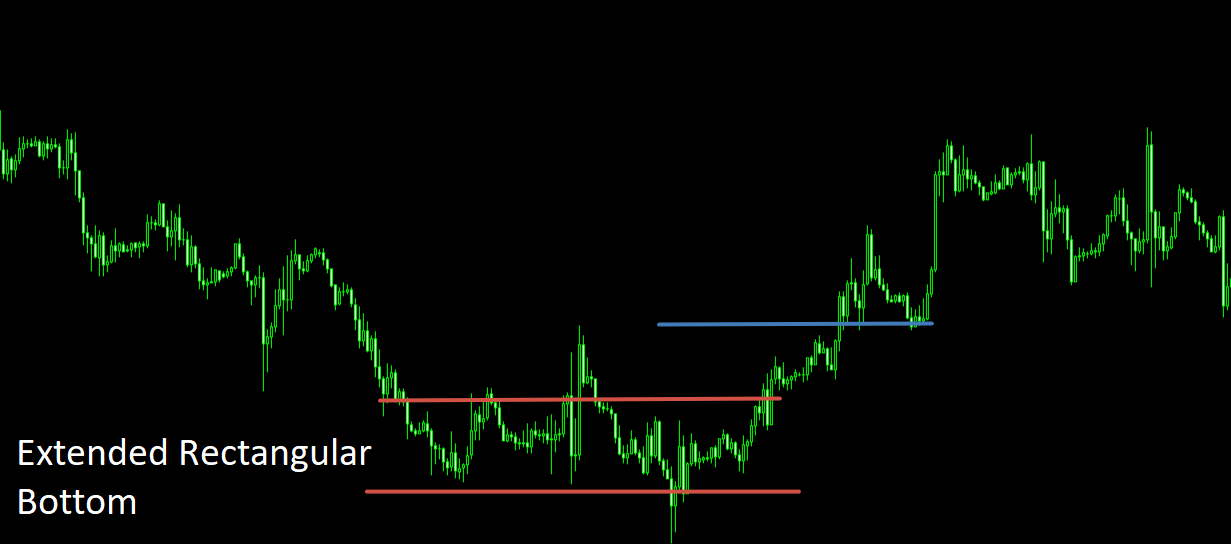
An extended rectangular bottom is a prolonged consolidation after a sustained decline, where price moves within a horizontal corridor. Essentially, it is a variation of a rectangle (sideways trend) that forms near long‑term lows. This pattern offers excellent opportunities for position accumulation with low risk. The closer price gets to the lower boundary of the rectangle, the shorter the distance to the stop‑loss, but fewer positions can be opened. Conversely, entering in the middle of the range gives more leverage but requires a wider stop.
A breakout above the upper boundary of the rectangle serves as a buy signal. The price target is often equal to the height of the rectangle itself, measured from the breakout point. On commodity markets, such patterns often occur when processors build inventories at low prices and speculators gradually accumulate long positions.
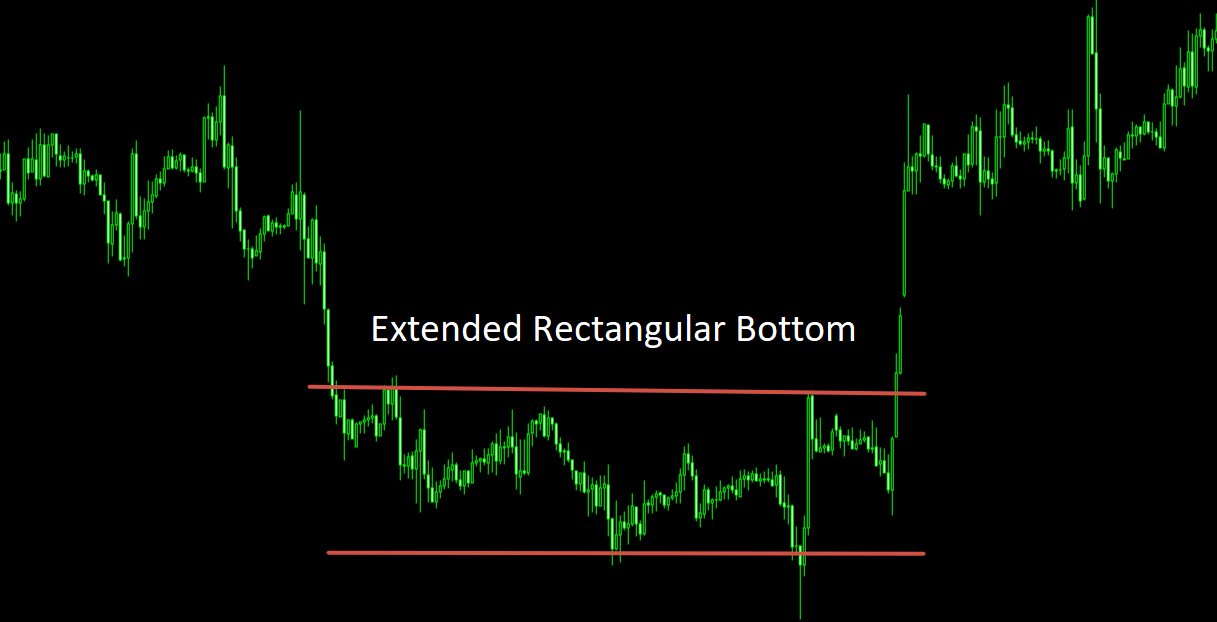
Trading strategy: buy when a candle closes above the upper boundary of the rectangle; place a stop‑loss below the last local low inside the pattern or below the lower boundary. To increase reliability, wait for volume confirmation – volume should rise noticeably on the breakout.
4. Rounded Tops & Bottoms
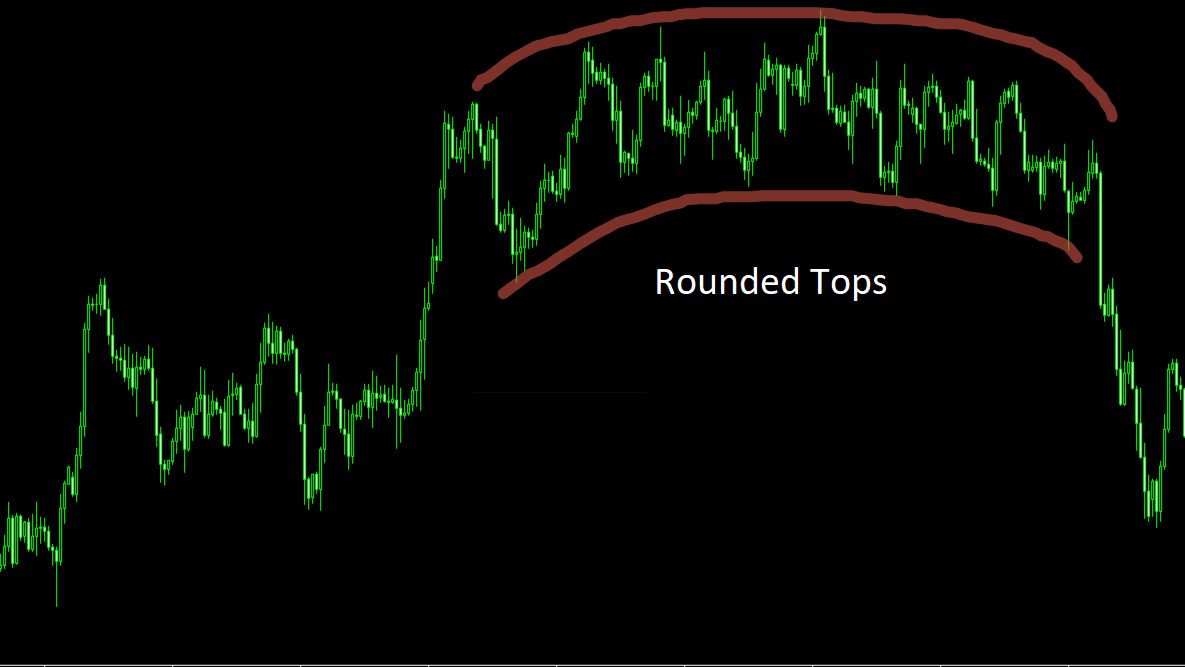
A rounded top (also called a “saucer”) forms gradually, reflecting a slow shift of market power from buyers to sellers. In the stock market this process is known as “distribution”. The uptrend slows, price peaks become progressively lower, and eventually a downtrend begins. Rounded tops often precede accelerating declines as more investors close long positions or open short ones.
A rounded bottom is the mirror figure, occurring after a long decline. Price gradually stops making new lows, and the reversal is smooth, without sharp V‑shaped moves. Such a bottom gives traders the opportunity to open long positions with comfortable risk. Like the extended rectangle, a rounded bottom can be used for position accumulation.
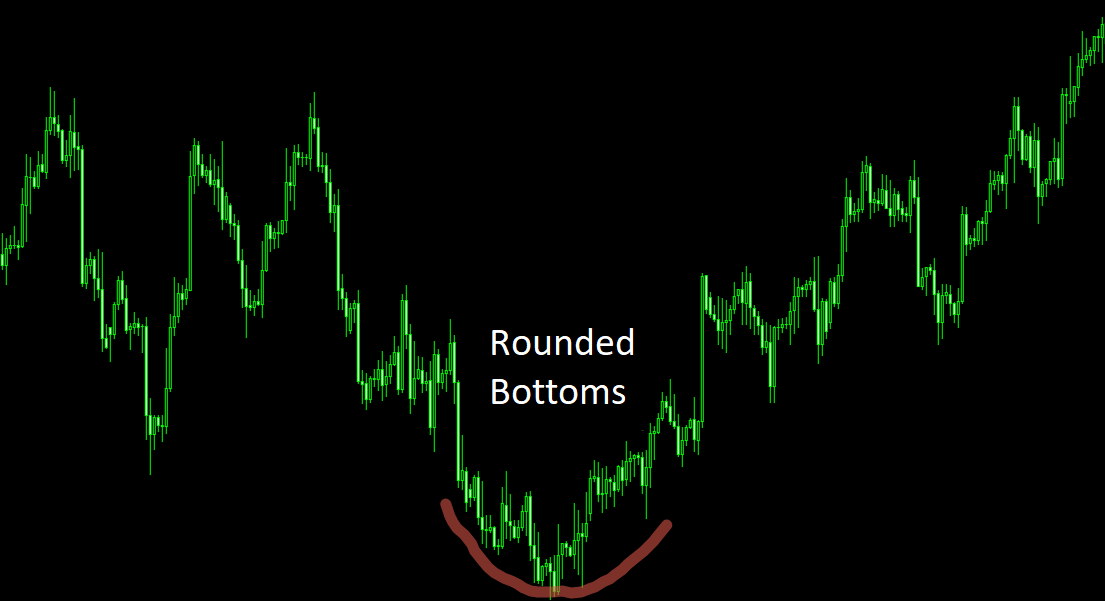
The entry point for a rounded bottom is usually determined after a breakout of the horizontal level drawn through the extreme points of the figure. Place a stop‑loss below the last local low. Due to the smooth nature of the figure, the trader‘s patience is rewarded with a strong and prolonged move.
5. Head and Shoulders
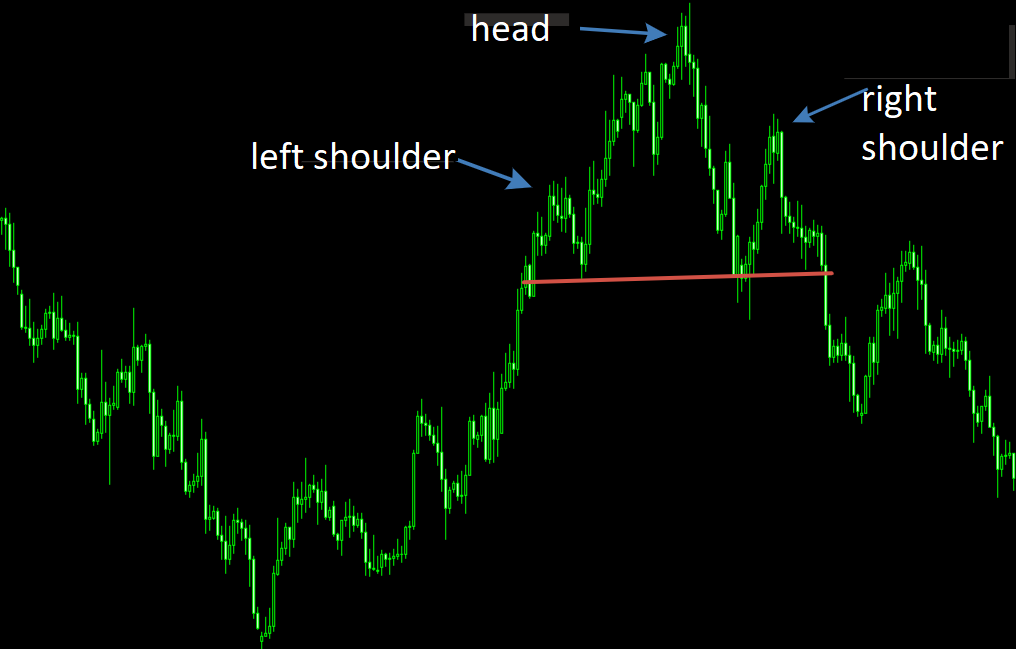
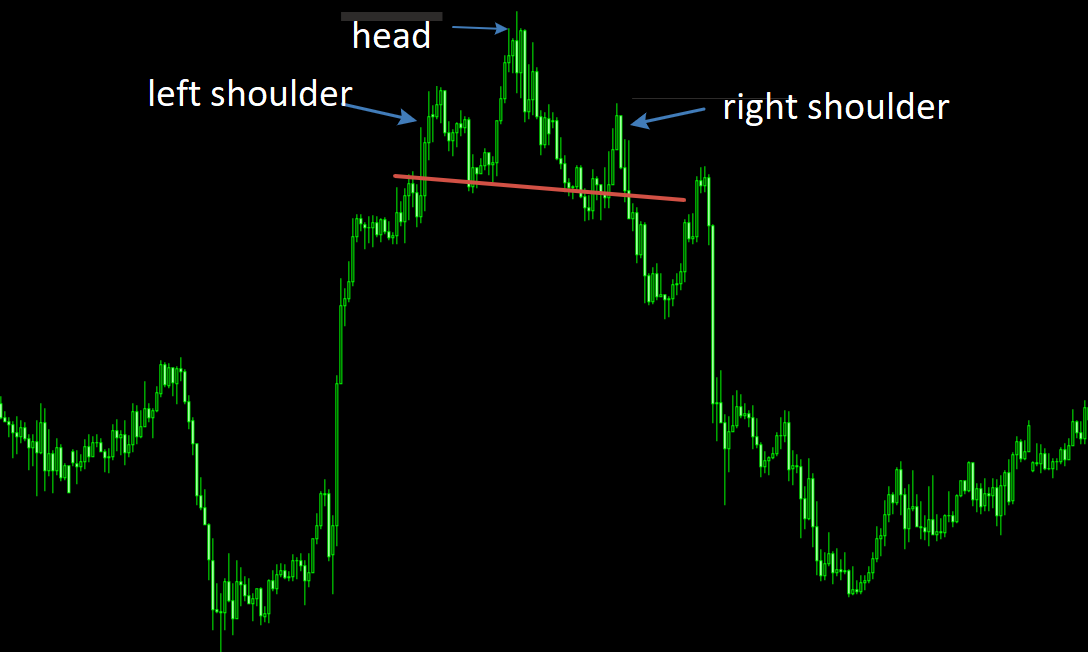
Head and Shoulders is one of the most reliable reversal patterns. It consists of a left shoulder, a head (the highest peak), and a right shoulder (usually lower than the head). Connecting the lows between the shoulders and the head gives the “neckline”. A break below this neckline confirms a reversal of the uptrend. There is also an inverted figure – an inverse Head and Shoulders – which signals a reversal of a downtrend to the upside.
The classic pattern has five characteristic features: 1) a strong rise with high volume; 2) consolidation (left shoulder) with decreasing volume; 3) a new high (head) on lower volume; 4) a pullback and formation of the right shoulder on even lower volume; 5) a break of the neckline. Although volume is not a mandatory condition in modern trading, its decrease on the head and right shoulder strengthens the signal.
Trading strategies for Head and Shoulders
There are three main approaches, differing in aggressiveness:
- Conservative (confirmed breakout): wait for a candle close below the neckline, then sell. Place a stop‑loss slightly above the entry (or above the right shoulder). Target – the distance from the head to the neckline, projected from the breakout point.
- Moderate (anticipating the right shoulder): sell when after the head price pulls back and begins to decline from the expected right shoulder. Stop‑loss – above the right shoulder‘s high or above the head. This gives a better entry price but requires more experience.
- Aggressive (early anticipation of the head): sell on the downward move while the right part of the head is forming. Stop – just above the current high. Risk is low, but success probability is also low – many small corrections may be mistaken for tops.
In any case, a stop‑loss above the head is the most conservative and allows you to test the reliability of the pattern before closing the position. The classic Edwards & Magee (1948) book attaches great importance to volume, but modern research shows that successful Head and Shoulders patterns exist without clear volume decline. Nevertheless, decreasing volume on the right shoulder should be considered an additional confirmation.
«The Head and Shoulders pattern is a battle between bulls and bears that the market loses on the right shoulder. Once the neckline is broken, the sellers‘ forces prevail.»
Practical tips for trading reversal patterns
- Always assess the higher‑timeframe trend. Reversal patterns work more reliably when they form after a prolonged and strong trend. Short moves are more likely to give false signals.
- Use volume as a filter. A true reversal is almost always accompanied by abnormally high volume at key points (head, neckline break).
- Wait for confirmation. The exception is V‑shaped figures, where confirmation comes too late. For double/triple tops and Head and Shoulders, it is better to wait for a neckline break.
- Combine with oscillators. Divergence on RSI or MACD at the second peak (top) or second trough (bottom) multiplies the probability of a reversal.
- Manage risk. The stop‑loss for reversal patterns is usually placed beyond the last extreme (above the head for short positions, below the bottom for long positions). Position size should be such that the loss does not exceed 1-2% of the account.
How technology extends the power of reversal pattern analysis
Manual pattern hunting for reversals – V‑tops, double/triple tops, Head and Shoulders – across dozens of charts and timeframes takes hours and requires intense focus. Modern services like AemmTrader offer a built‑in Pattern Analyzer – automatic recognition of classic chart patterns on all timeframes. AI draws the boundaries on the chart and determines whether the figure is a continuation or reversal pattern.
The system recognises more than 15 patterns: Head and Shoulders, Inverse Head and Shoulders, Double Bottom, Double Top, Triple Tops and Bottoms, V‑shaped reversals, Rounded Tops and Bottoms, Expanding Formations and others. The neural network not only identifies the figure but also calculates the neckline level, the potential price target, and the probability of a successful breakout.
You only need to assess the objective probability provided by the algorithm and make your trading decision. Using such tools, you can find reversal patterns faster, backtest hypotheses on historical data, and make decisions based on objective data rather than intuition. This is the bridge between amateur and professional approaches – saving time and increasing efficiency.